
Alpha from LLM-measured “distant” stock picks + the correct way to use Sharpe ratios
Welcome to Academic Signal, where we decode finance research into plain English to surface ideas that matter to professional investors.
In this week’s report:
How “distant investments” reveal true fund skill
How to judge Sharpe ratios without fooling yourself
1. The stock-picking edge in “distant” names
Distant Investments: Decoding Mutual Fund Skill with Large Language Models (Sept. 21, 2025) - Link to paper
TLDR
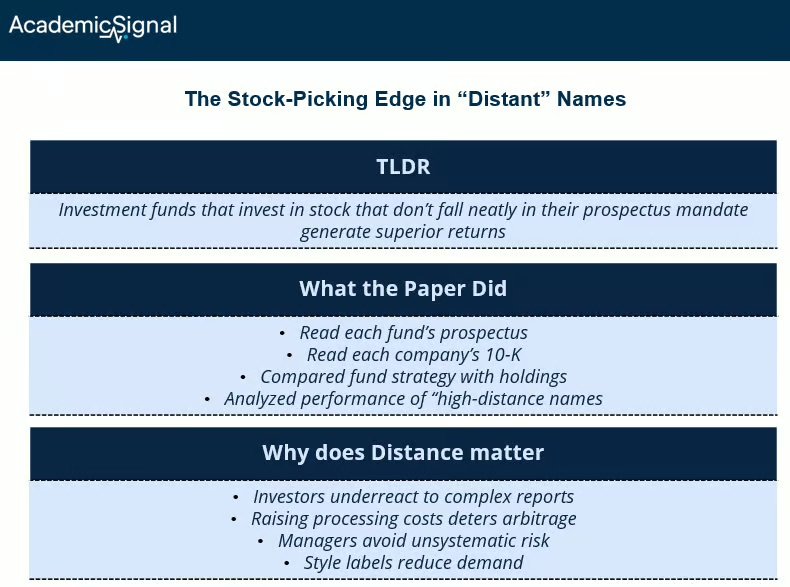
Investment funds that invest in stocks that don’t fall neatly in their prospectus mandate generate superior returns. “High-distance” names are still inside the fund’s mandate, but they don’t line up neatly with the fund’s label or benchmark peers. Those names are harder to process and less comfortable to own, so fewer managers compete there. When information is harder and the buyer set is smaller, mispricing lasts longer. That is where real research and skill earn their keep.
What the paper did
For each investment fund, the authors read what it says it’s trying to do in its prospectus (its stated strategy).
For each company that the fund actually invested in, they read the “Business” section of its 10-K (Item 1), which explains what the company does.
Then, they used a text-matching score to see how different those two descriptions were. If a stock’s business looked very different from the fund’s stated strategy, that stock got a high “distance” score.
Next, they looked at where a fund is making real, active bets (positions that are meaningfully bigger or smaller than the benchmark), and noted the distance of those positions.
Finally, they ran tests: did the active bets that were “off theme” (high distance) pay off more than equally active bets that were “on theme” (low distance)?
Why does distance matter?
The Business text in the 10-K is harder, so investors underreact: When firms change what they do or how they describe it, the signal often lives in words, not simple ratios. Investors systematically underreact to textual changes in 10-Ks; substantive edits predict future returns because many readers don’t fully process the text right away. That is the core result in “Lazy Prices.” (Harvard Business School) If a holding’s business description diverges from a fund’s boilerplate, it is usually one of those text-heavy cases that take real work to digest.
Complex reports raise the processing cost: Lower readability and higher disclosure complexity are linked to slower price discovery and larger mispricing. (ScienceDirect) Less readable 10-Ks are associated with mispricing and even higher crash risk (because bad news can be buried), which is exactly the kind of “hard” situation that rewards deep analysis. High-distance names tend to come with this complexity profile.
Limits to arbitrage keep prices wrong longer: Even if a stock looks mispriced, arbitrage is risky and costly. (Harvard Scholar) Idiosyncratic risk, noise-trader risk, and implementation frictions deter capital from leaning in. That’s especially true for “off-label” names that won’t hedge cleanly against a benchmark. The less obvious the business, the more basis risk the manager must bear while waiting to be right.
Career risk and benchmarking push managers away: Managers are evaluated on short windows. Younger or more flow-sensitive managers are especially penalty-sensitive and avoid unsystematic risk, herd into popular sectors, or hug the index. (MIT Economics) That bias starves the weird but attractive names of patient capital, leaving more alpha for the few who underwrite them well.
Style labels shrink the natural buyer base: “Growth fund” buyers expect “growth-sounding” stocks. Holdings that read off-theme invite questions from consultants, boards, and clients, so many funds prefer on-label positions even when risk/return is better elsewhere. This is the closet-indexing / low-active-share problem in practice. High-distance names face less demand from label-constrained money.
How to use it
Manager due diligence: Ask managers to show which positions are distant and why their team can underwrite them.
Internal oversight: Build a lightweight distance screen using prospectus text and Item 1 for your coverage. Use it to surface names where fundamental writeups should be higher priority.
Alpha research: Test stock-level predictability from distant purchases by skilled funds. The paper finds these buys forecast returns and help prices incorporate new information faster.
2. Sharpe ratios you can trust: how to judge a backtest without fooling yourself
How to Use the Sharpe Ratio (Oct. 4, 2025) - Link to paper
TLDR
Raw Sharpe is easy to inflate. The paper gives a simple toolkit to judge whether a Sharpe ratio is real: PSR turns a Sharpe into a probability, MinTRL tells you how much data you need, DSR penalizes multiple tries, and FDR helps when you select many winners. Use FWER rules when you must pick one winner; FDR rules when you pick a basket.
What the authors did
They reviewed why Sharpe often misleads in practice, especially with short histories and non-Normal returns. They then pulled together practical fixes: Probabilistic Sharpe Ratio (PSR), Minimum Track Record Length (MinTRL), Deflated Sharpe Ratio (DSR), and simple false discovery controls for single and multiple selections. They showed with simulations that these tools beat naive t-tests and uncorrected Sharpe screens.
The tools in plain English
PSR: convert a Sharpe into a probability - PSR answers a clear question: given your Sharpe and sample, what is the chance the true Sharpe is above a hurdle (for example 0 or your fee hurdle)? PSR accounts for sample length and non-Normal returns. Example: a backtest shows SR=0.6 over 24 months with fat tails. PSR might say 88% that the true SR exceeds 0.0, but only 60% that it exceeds 0.3.
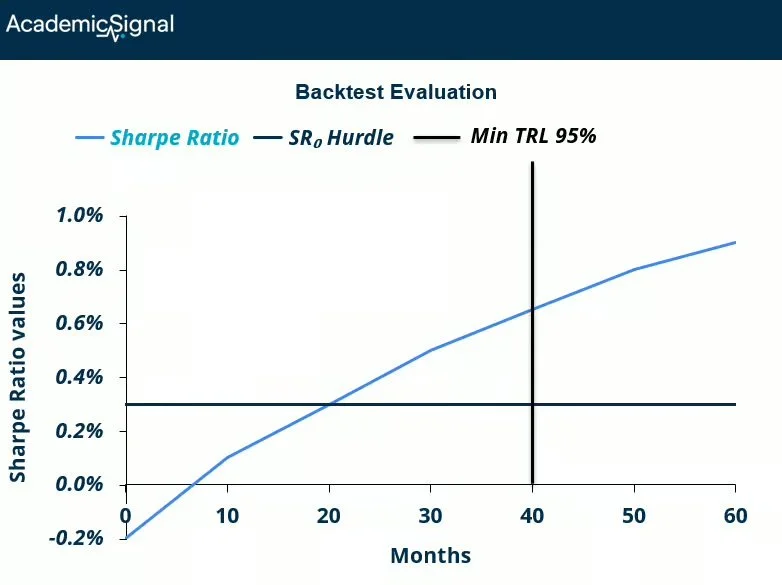
MinTRL: how much data you needed - MinTRL flips the PSR logic. It tells you the minimum months you should have had to be 95% sure your true SR beats your hurdle. Example: if your claimed SR=1.0 but MinTRL vs a 0.5 hurdle at 95% is 48 months and you only have 18, the claim is not yet supported.
DSR: punish multiple tries and non-Normality - If a team tried K variants and only shows the best, the headline Sharpe is biased up. DSR deflates that Sharpe based on the number of trials and the shape of returns. Example: 20 parameter sets tried, best SR=0.9. After DSR, the adjusted SR could drop to 0.3
Picking 1 vs many: FWER vs FDR - If you must choose a single winner, control the familywise error rate (FWER). If you will fund several signals or several PMs, control the false discovery rate (FDR) so you keep the share of false positives low while not killing power. Use FDR for wide funnels, FWER for winner-takes-all.
Why this matters
Short samples, fat tails, and strategy fishing are the norm in pitchbooks. That mix makes raw Sharpe a poor judge of true skill. PSR and MinTRL stop you from over-reading short, bumpy tracks. DSR and FDR/FWER stop you from paying for curve-fit alpha.
How to use this
Report SR, PSR(p>SR0), and your SR0 hurdle. Require PSR>=95% vs SR0 that reflects fees and risk.
Compute MinTRL at 95% vs SR0. If history<TRL, label as “insufficient evidence.”
Ask for K, the number of tested variants. If K is unknown, estimate an effective K from the dispersion of tried Sharpe values. Apply DSR.
Match the error control to the decision. One pick: FWER. Several picks: FDR.
Two quick examples
Example A: single strategy pitch
Track: 36 monthly returns. SR=0.7. Returns are skewed and leptokurtic (heavy tails with more extreme moves than a normal bell curve). Team tried 12 variants.
PSR vs SR0=0.25 comes out 78%. MinTRL at 95% vs 0.25 is 44 months. DSR knocks SR from 0.7 to 0.25. Decision: don’t fund yet. Keep in a paper portfolio and revisit at 48 months.
Example B: sleeve of signals
You plan to select 10 of 60 candidate signals. Use FDR at 10% so you expect 1 false among the 10.
For each candidate, require PSR>=95% vs SR0 that reflects fees and slippage, and prefer those that still clear after DSR.
Disclaimer
This publication is for informational and educational purposes only. It is not investment, legal, tax, or accounting advice, and it is not an offer to buy or sell any security. Investing involves risk, including loss of principal. Past performance does not guarantee future results. Data and opinions are based on sources believed to be reliable, but accuracy and completeness are not guaranteed. You are responsible for your own investment decisions. If you need advice for your situation, consult a qualified professional.