
Macro Pattern Matching Beats Traditional Portfolios by 2x
Hey, I’m KP and thank you for joining 45,000+ professional investors reading my weekly newsletter. Each week, I work with PhDs to translate top-tier finance research into plain English — revealing evidence-based ideas that matter to professional investors, analysts, and CIOs.
In this week’s report:
Historical patterns are only useful when the economic environment matches: Macro pattern matching beats traditional portfolio strategies by 2x
How to nearly double momentum's Sharpe ratio by hedging the risk you're not getting paid for
Research-grounded Investor Q&A: “Is there signal in 13F filings, or is institutional ownership data too stale to trade on?”
Presented by Investment Analyst AI
Interested in executing with AI? Unlock Hidden Financial Signals in Our Free, Hands-On AI Workshops
→ Identify market signals no one’s tracking
→ Build dashboards that turn alt-data into actionable insights
Spots are limited, sign up now: InvestmentAnalyst.ai
1. Historical patterns are only useful when the economic environment matches: Macro pattern matching beats traditional portfolio strategies by 2x
Online Portfolio Selection Using Macroeconomic Pattern Matching (January 22, 2026) - Link to paper
The core idea
Most quantitative strategies treat all historical data the same. A trading day from 2019 counts just as much as one from 2008. But markets behave differently depending on whether inflation is rising, rates are falling, or unemployment is spiking.
What if we only used historical periods that look like today's economic environment?
Their system delivered twice the returns of buying and holding the S&P 500.
How the system works
Step 1: Find stocks that actually respond to the economy
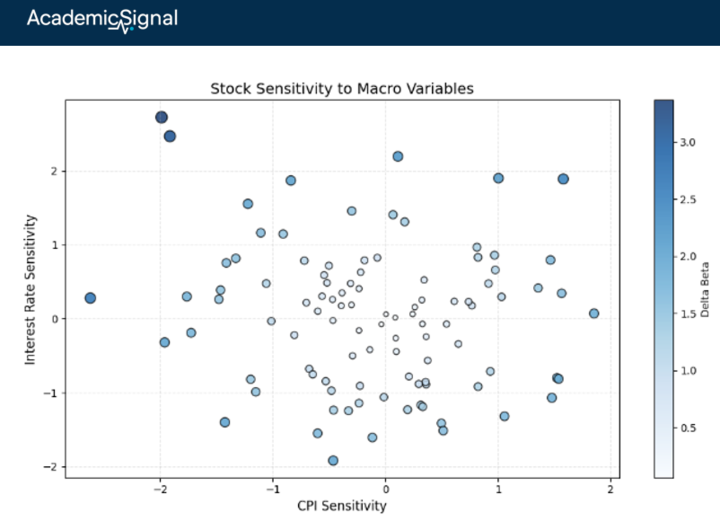
Not all stocks care about macroeconomic changes. Tech stocks might surge regardless of CPI. Utility stocks might ignore GDP shifts. The authors filter for stocks that show clear sensitivity to macro variables.
They measure this using "Delta Beta" – a metric that captures how strongly a stock reacts when macro variables move. A stock with high Delta Beta swings meaningfully when inflation rises or falls. A stock with low Delta Beta ignores macro shifts entirely. The system keeps the high Delta Beta stocks because they carry useful information about where the economy is heading.
Step 2: Group similar stocks together
To avoid putting all eggs in one basket, the authors cluster stocks into groups. Instead of using standard correlation (which only captures linear relationships), they use a metric called Symmetric Uncertainty that also detects nonlinear patterns. From each cluster, they'll eventually pick one stock, ensuring the final portfolio is diversified.
Step 3: Match today's economy to history
This is the key innovation. The system looks at seven macro variables (interest rates, unemployment, GDP, industrial production, debt-to-GDP, CPI, and PPI) and finds the historical period that most closely resembles today.
Think of it like weather forecasting: if today's temperature, humidity, and pressure match a pattern from last spring, you'd expect similar weather. The system does the same with economic conditions.
Once it finds the matching macro period, it then looks at how stock prices behaved during that time. It finds price patterns similar to current patterns and uses what happened next as a forecast.
Step 4: Weight the signals by importance
Not all macro variables matter equally. The authors measure how strongly each variable's movements spill over into stock returns. CPI and interest rates transmit the biggest shocks, so they get more weight in the final signal.
The results
The equal-weighted macro pattern matching portfolio achieved:
110% cumulative returns vs 50% for the S&P 500
Sharpe ratio of 1.32 vs 0.82 for the benchmark
Strong upside capture with limited downside: the portfolio gained 90% of market rallies but only suffered 20% of market crashes
When the authors removed the macroeconomic matching step – just using price patterns alone – returns collapsed to 25%. The macro regime conditioning is what makes the system work.
Which macro variables matter most
CPI and interest rates dominate. When running the model with only CPI, it still achieved a Sharpe ratio of 0.50. With only interest rates, 0.41. Every other variable delivered less than half that performance.
Removing CPI or interest rates from the full model caused the biggest performance drops – roughly 40% worse results. GDP, despite its headline importance, contributed the least signal.
The bottom line
Historical patterns are only useful when the economic environment matches. Before running any momentum or pattern-matching strategy, first identify which macro regime you're in. Focus on stocks that actually respond to economic shifts (high Delta Beta), and weight your analysis toward CPI and interest rates, the two variables that most reliably move stock prices.
2. How to nearly double momentum's Sharpe ratio by hedging the risk you're not getting paid for
The Unpriced Risk in Momentum Strategies (February 5, 2026) - Link to paper
The hidden drag on momentum returns
Momentum investors have long known their strategy's betas fluctuate wildly over time. This time-variation creates uncompensated risk that crushes risk-adjusted returns.
Here's the mechanism: when markets fall, low-beta stocks outperform high-beta stocks mechanically. So low-beta stocks drift into the winner portfolio while high-beta stocks become losers. The momentum portfolio is now long low-beta, short high-beta—it has negative market exposure.
If the market factor had positive autocorrelation (momentum), this would be great timing: you'd be short market beta right before more declines. But that’s not the case: regressing each Fama-French factor's return in month t+1 on its trailing 12-month average yields no significant predictability.
So this induced negative beta is just a random bet. Sometimes the market rebounds (and you get crushed), sometimes it keeps falling (and you win). On average, it adds variance but zero expected return. That's the definition of unpriced risk.
It's not just market beta
The same dynamic plays out across all factor exposures, and the data shows value (HML) is actually the dominant exposure (not market):
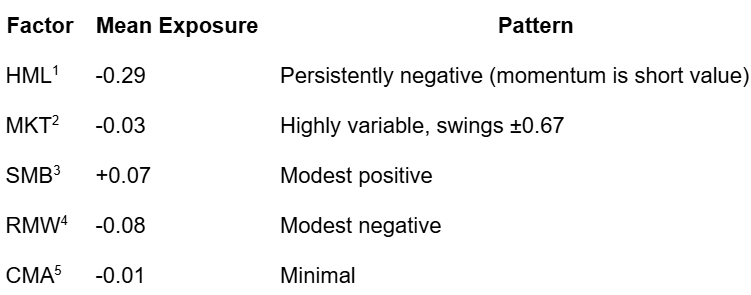
Momentum is consistently short value because growth stocks tend to be recent winners. But since HML shows no autocorrelation either, this is another uncompensated bet.
The April 2009 crash illustrates this perfectly: the -46% drawdown was driven by both the market rebound (-24% contribution) and a value rally (-13% contribution). Hedging only market beta would have missed half the problem.
Why traditional hedging fails
The obvious solution – estimate your portfolio's factor betas and hedge them – doesn't work. Daniel and Moskowitz (2016) showed that real-time time-series hedging fails to prevent momentum crashes. The problem: rolling beta estimates are stale by the time you use them. The portfolio rotates faster than regressions can track.
The paper's innovation is to sidestep beta estimation entirely.
The cross-sectional approach
Instead of building a momentum portfolio and then hedging its factor exposures, the authors decompose the momentum signal itself before portfolio formation.
Step 1: Define Y (what you're decomposing)
For each stock, calculate its momentum characteristic: cumulative return from month t-12 to t-2 (skipping the most recent month to avoid short-term reversal).
Step 2: Define X (the factor-related characteristics)
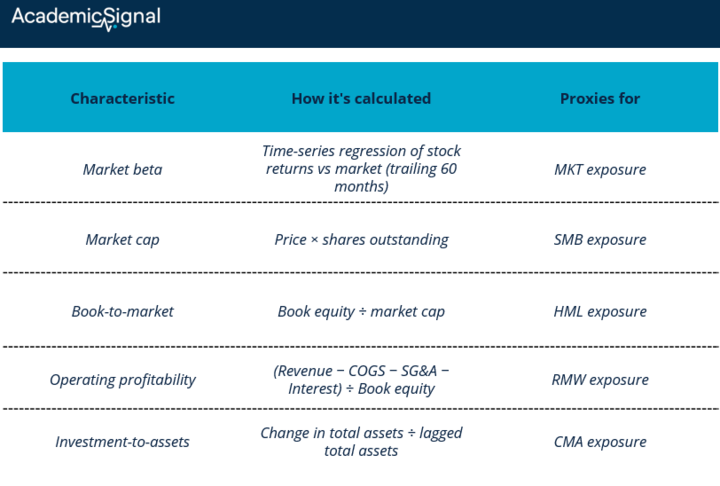
Step 3: Rank-standardize everything
All five characteristics are converted to percentile ranks scaled to [-0.5, 0.5] each month. For example, with market cap:
Rank all stocks by market cap (1 to N)
Divide by N to get percentile (0 to 1)
Subtract 0.5 to center at zero (-0.5 to +0.5)
Apple at $3 trillion becomes +0.5 (largest). A micro-cap becomes -0.5 (smallest). This prevents outliers from distorting results and makes coefficients comparable across characteristics with very different scales.
Step 4: Run one cross-sectional regression per month
momentum_i = θ₀ + θ₁(beta_i) + θ₂(size_i) + θ₃(B/M_i) + θ₄(profit_i) + θ₅(invest_i) + residual_i
With ~3,000 stocks, you get ~3,000 observations per regression. This is a single cross-sectional regression each month; not a time-series regression for each stock.
Step 5: Sort on residuals
The residual for each stock is its "specific momentum": past returns unexplained by factor-related characteristics. Sort stocks into deciles on residuals. Go long top decile, short bottom decile.
The fitted value (predicted momentum from characteristics) is "systematic momentum" – the unpriced component you're discarding.
What the regression is really asking
The cross-sectional regression asks: "How much of this stock's past return can I explain from where it sits in the distribution of beta, size, value, profitability, and investment?"
If Apple returned 25% but its growth tilt and large size predicted 20%, the unexplained 5% residual is specific momentum. That's the signal you trade on.
The key insight: characteristics update instantly
This approach works where time-series beta estimation fails because firm characteristics proxy for factor loadings without estimation lag. A high book-to-market stock is assumed to have value exposure; a small stock has size exposure. When the portfolio rotates, the characteristics reflect this immediately.
You never estimate portfolio betas. You never trade factor hedges. You just change which stocks you're sorting on.
The results
The systematic component (SYS) carries volatility nearly matching total momentum – 6.90% monthly standard deviation – yet earns just 0.08% per month. That's a Sharpe ratio of 0.04. Pure unrewarded noise.
The specific component (SPC) retains 1.14% monthly return (versus 1.20% for total momentum) but with volatility cut to 3.76%. The Sharpe ratio jumps from 0.61 to 1.05.
Even accounting for transaction costs (turnover rises modestly from 63% to 70%), the hedged strategy delivers a net Sharpe of 0.45 versus 0.30 unhedged – a 50% improvement.
The bottom line
Strip out momentum's unpriced systematic risk and you get a cleaner, higher-Sharpe strategy that largely avoids crashes. You're not hedging your bets after the fact – you're avoiding the uncompensated bets in the first place.
3. Research-grounded Investor Q&A: “Is there signal in 13F filings, or is institutional ownership data too stale to trade on?”
Yes, there is economically meaningful signal in 13F data, but extracting it requires filtering rather than simple replication. The staleness concern is valid for short-horizon traders but largely irrelevant for investors focused on manager conviction and longer holding periods.
The "Best Ideas" Signal Is Real
The foundational finding comes from Antón, Cohen & Polk (2021), who demonstrated that the highest-conviction positions of active fund managers – their "best ideas," defined as stocks with the largest portfolio weight relative to market weight – outperform both the market and the managers' other holdings by 2.8% - 4.5% per year, depending on benchmark. Crucially, this outperformance shows no subsequent reversal, indicating genuine mispricing rather than temporary price pressure. The other stocks managers hold – the "filler" positions added for diversification – generate essentially zero alpha.
Angelini, Iqbal & Jivraj (2019) extend this to hedge funds specifically, constructing "conviction" and "consensus" measures from 13F data. Their strategy combining both metrics outperformed the S&P 500 by 3.80% annually with a Sharpe ratio of 0.75 over 2004-2019. The key insight: you must select managers with longer-term views on stock picks. Quantitative hedge funds that turn over positions rapidly show no copyable alpha. Their edge decays before the 45-day filing deadline.
Cloning Works… If You Clone Selectively
Schroeder & Posch (2024) analyzed over 150,000 portfolios from 2013-2023 and found that cloned portfolios in the top quartile of underlying fund performance exceeded the S&P 500 by 24.3% on an annualized risk-adjusted basis. Cloned portfolios rebalanced on the disclosure date successfully mirrored the performance of original funds across twelve metrics. The crucial finding: cloning works for both outperformers and underperformers, meaning the 13F data genuinely reflect the underlying fund's positioning, it's just a matter of which funds you choose to follow.
Why The Delay Matters Less Than You Think
Kwon (2022) documented that long-term stock investors – hedge funds and pension funds with low turnover – are the primary targets of copycats because their positions remain relevant despite the 45-day lag. Top-performing long-term investors see significant positive market reactions when their newly purchased stocks are disclosed, while short-term traders see no such effect. The logic is straightforward: if a fund's average holding period is 2+ years, a 45-day delay represents less than 6% of the investment horizon.
The Hidden Alpha: Confidential Holdings
The most informative 13F positions are the ones you don't see immediately. Agarwal, Jiang, Tang & Yang (2013) studied "confidential holdings" – positions disclosed with delay via Form 13F amendments. These holdings exhibit superior performance for up to 12 months and are disproportionately associated with information-sensitive events like M&A. Funds managing large risky portfolios with non-conventional strategies seek confidentiality most frequently.
More recently, Cao, Da, Jiang & Yang (2021) uncovered that hedge funds strategically misreport initial 13F holdings, then file restatements to correct them. Restated holdings earn 3.6 basis points daily (≈9% annualized) in abnormal returns. They constructed a "restatement return gap" measure that predicts future fund performance, meaning the corrections themselves signal where informed money is flowing.
Implementation Considerations
The signal extraction requires three filters:
Manager Selection: Focus on fundamental, long-only equity hedge funds and concentrated active mutual funds; not quant shops or diversified index-huggers. Angelini et al. found that hedge funds classified as "Fundamental Equity" produced copyable alpha, while broader classifications (including multi-strategy and quantitative funds) did not.
Position Selection: Weight toward high-conviction positions. Best ideas are typically defined as positions where portfolio weight exceeds benchmark weight by the widest margin, or positions in the top 3-5 by absolute weight.
Signal Decay Awareness: Aggregate institutional ownership changes (which stocks are being accumulated across many funds) predict returns for 3-6 months. Individual manager positions have longer persistence if the manager has demonstrated skill.
The Data Quality Caveat
One underappreciated issue: 13F data contains meaningful errors. Anderson & Brockman (2016) documented "widespread significant reporting errors" when comparing 13F-reported shares to proxy statements. The SEC performs minimal oversight. An internal audit found that most monitoring only occurs after public complaints. Researchers and practitioners using third-party databases like Thomson-Reuters should expect inconsistencies, particularly in historical data before the 2013 XML mandate.
The Bottom Line
The 45-day delay is a red herring for the wrong strategy. If you're trying to front-run hedge fund momentum trades, yes, the data is stale. But if you're identifying which managers have stock-picking skill and tilting toward their highest-conviction positions, 13F data remains economically valuable. The research consensus: best ideas of skilled managers outperform by 3-5% annually, even after accounting for the disclosure lag, with no evidence of return reversal.
Disclaimer
This publication is for informational and educational purposes only. It is not investment, legal, tax, or accounting advice, and it is not an offer to buy or sell any security. Investing involves risk, including loss of principal. Past performance does not guarantee future results. Data and opinions are based on sources believed to be reliable, but accuracy and completeness are not guaranteed. You are responsible for your own investment decisions. If you need advice for your situation, consult a qualified professional.