
The CEO Pay Metric Everyone Uses… Doesn’t Work
Hey, I’m KP and thank you for joining 45,000+ professional investors reading my weekly newsletter. Each week, I work with PhDs to translate top-tier finance research into plain English — revealing evidence-based ideas that matter to professional investors, analysts, and CIOs.
In this week’s report:
CEOs’ percent of pay at risk – the metric boards and ISS use – correlates negatively with stock performance and is NOT statistically significant (here’s what IS)
How to separate the best bond funds from the worst (and there’s a big gap!)
Research-grounded Investor Q&A: “Does managerial pedigree predict stock performance?”
1. CEOs’ percent of pay at risk – the metric boards and ISS use – correlates negatively with stock performance and is NOT statistically significant (here’s what IS)
CEO Pay has a Big Impact on Future Stock Returns (February 19, 2026) - Link to paper
TLDR
Conventional pay measures (percent at risk, target pay percentile) have zero predictive power for future stock returns. But "relative pay risk" and performance-adjusted pay premiums do.
A long/short portfolio based on these better pay dimensions delivers 7.7 percentage points of excess return over 3 years (t-stat 2.7) and 19.6 points over 5 years (t-stat 3.9).
High pay premiums at industry-average performance hurt returns, but strong incentive alignment (measured correctly) helps. Standard "percent of pay at risk" misses this entirely.
What the author did
Stephen O'Byrne of Shareholder Value Advisors built a mark-to-market pay database for S&P 1500 CEOs from 1992–2024 using Execucomp grant data. He regressed log relative pay against log relative TSR over rolling five-year windows to extract four pay dimensions for each CEO: pay leverage, pay alignment, relative pay risk, and the pay premium at industry-average performance. He then tested which dimensions predict future 3- and 5-year relative stock returns across 26,199 observations.
How the pay dimensions work
The key insight is that conventional metrics are broken. Two CEOs with identical "90% pay at risk" can have wildly different actual incentive strength.
Why? Because most boards target a fixed dollar amount for equity compensation (typically, the peer group median). To deliver that dollar amount, they divide equity comp by the current stock price to determine the shares to be granted. So when a stock rises, the CEO gets fewer shares to hit the same dollar target. When it falls, they get more shares.
For example: ConocoPhillips CEO Ryan Lance saw his stock price rise 137% from 2021 to 2024, but his grant shares dropped 55% (and his total comp barely moved). Marathon Oil's CEO saw the opposite: a 50% stock price decline, but grant shares more than doubled, and his total comp actually increased 8%.
This creates a path-dependent problem. A CEO whose stock drops early accumulates large share grants at low prices. If the stock later recovers, all those shares reprice upward. The result: that CEO's cumulative pay over five years swings wildly. A CEO whose stock rose steadily has the opposite experience: fewer shares, gradual appreciation, a smooth pay path. Same "percent at risk," but one CEO's total pay trajectory is far more volatile than the other's.
That volatility is the real measure of how strongly the CEO's wealth is tied to stock performance.
O'Byrne's fix: regress each CEO's actual realized pay against the company's risk-adjusted stock performance over five years. That single regression line gives you three things.
The slope tells you how sensitive the CEO's pay is to performance. O'Byrne calls this "pay leverage."
The intercept tells you the CEO's pay premium at average industry performance. Essentially, that’s what the CEO costs after adjusting for results.
And the correlation tells you how consistently pay and performance move together.
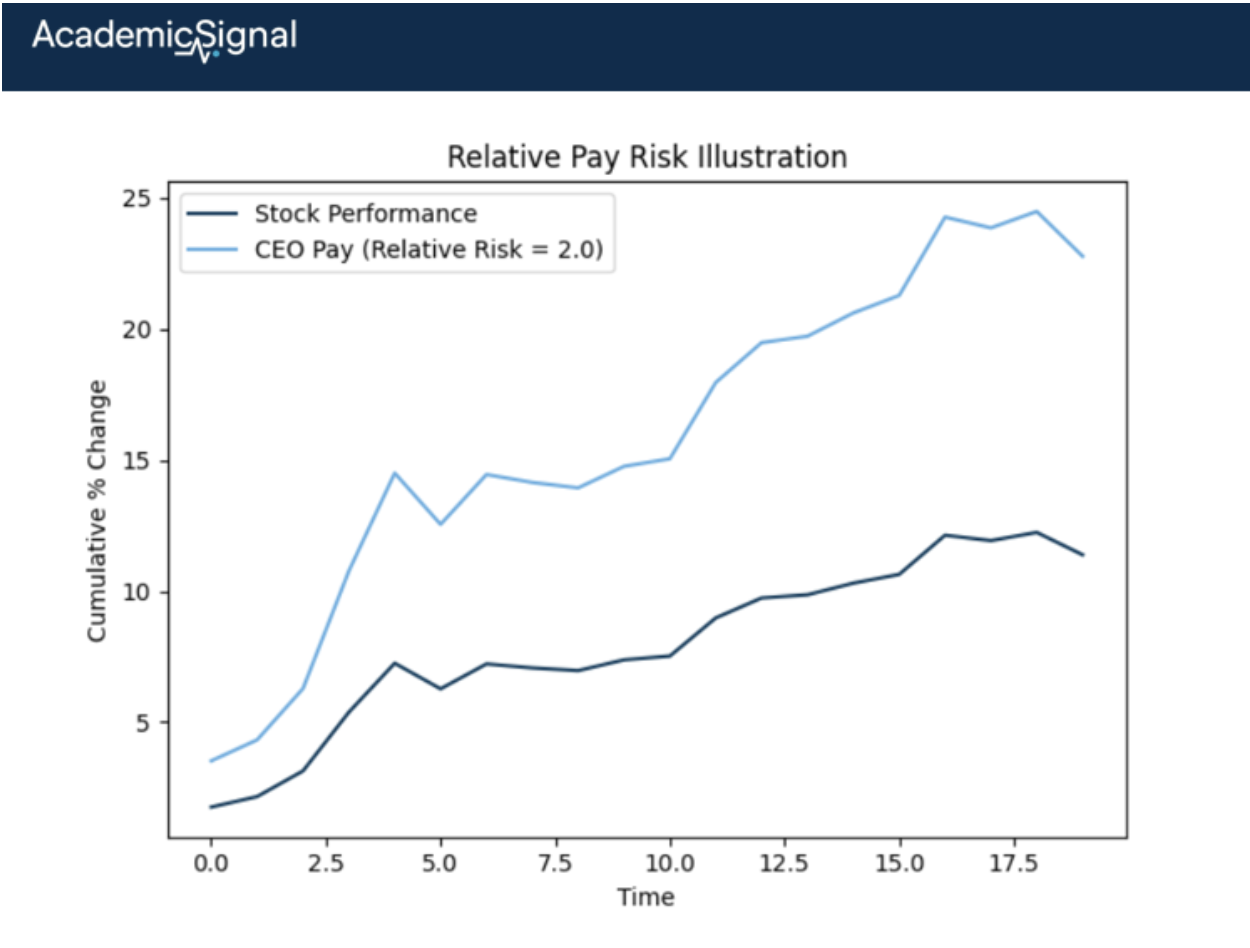
The key predictor of future stock returns turns out to be "relative pay risk", defined as the ratio of pay variability to stock variability. The wider the range of pay outcomes relative to stock outcomes, the stronger the signal.
Relative pay risk = standard deviation of pay ÷ standard deviation of stock performance
A ratio of 1.0 means pay and stock performance move in lockstep. A ratio of 2.0 means that when the stock's performance varies by 10%, the CEO's pay varies by 20%. The median S&P 1500 CEO has a relative pay risk of about 1.5. Lou Gerstner at IBM clocked 1.74, meaning his pay was 74% more volatile than IBM's stock. The higher this ratio, the more the CEO's wealth is genuinely on the line, and the stronger the predictive signal for future stock returns (t-stat 7.3, the most significant variable in the model).
Example of what can push the ratio above 1.0 (pay swings more than stock):
Stock options have embedded leverage. If a CEO holds options with a $50 strike and the stock goes from $60 to $66 (10% move), the option's intrinsic value goes from $10 to $16, a 60% move. Options mechanically amplify stock volatility into pay volatility.
Performance share vesting multiples range from 0x (below 25th percentile TSR) to 2.0x (above 75th percentile). A CEO near a threshold can see their payout double or get zeroed based on a small move in relative performance.
The path-dependent grant share accumulation we discussed: bad early performance loads up shares, making later pay swings disproportionately large.
How to build this yourself
Since 2022, every public company must disclose five years of "Compensation Actually Paid" (CAP) in their proxy. That's mark-to-market pay for the CEO and the average of other top-5 executives. Sum up the annual CAP figures, benchmark them against market pay for the CEO's industry and company size, and run the regression against risk-adjusted stock performance. That gives you all four dimensions.
Two gotchas to watch for. First, CAP includes value changes from equity granted before the five-year window. That contaminates the pay-performance match. O'Byrne suggests using holdings data to strip out prior-period grants. Second, CAP freezes option values at vesting, while options still provide incentive until exercise. Despite these gaps, O'Byrne shows his estimates and the CAP-based figures are highly correlated across 90% of cases. The data is workable, just not perfectly clean out of the box.
What the data shows
Relative pay risk – not pay leverage – is the strongest predictor of future returns (t-stat 7.3). O'Byrne's explanation: it's a cleaner signal, statistically significant in 80% of individual CEO regressions vs. only 40% for pay leverage.
The cost side matters too. Overpaying at average performance drags on future returns (t-stat -6.9). But underpaying doesn't help… low pay isn't an automatic alpha source.
How big is the effect? Companies with top-decile pay structures outperform bottom-decile by 8.4 percentage points over 3 years and 11.1 points over 5 years.
Meanwhile, percent of pay at risk – the metric boards and ISS actually use – has a negative coefficient and is not statistically significant. The industry's primary incentive measure contains no real information.
Important caveats
The long/short portfolios are built within size and prior-return quintiles, which partially controls for size and momentum. But O'Byrne doesn't run results through a formal Fama-French five-factor model or report sector or market-cap breakdowns. That matters – overpaid CEOs at underperforming firms could overlap with value or low-profitability names, and investors would want to know if the signal concentrates in small caps or varies across industries. These are the most obvious areas where future research could strengthen (or challenge) the findings.
Editor's perspective: an alternative explanation the paper doesn't explore
O'Byrne's interpretation is optimistic: volatile pay means the CEO feels a stronger incentive, works harder, and creates more value.
But consider a CEO who expects a five-year tenure and understands the grant mechanics. They have a rational incentive to sandbag early – not destroy value, but delay it. Be conservative on guidance, defer a product launch by a quarter, hold back on margin expansion. The stock stays flat or dips, and the board keeps issuing larger and larger share grants to hit the same dollar target. By year three, the CEO is sitting on a mountain of shares accumulated at depressed prices.
Then they let real performance flow through. The stock recovers, every accumulated share reprices upward, and the CEO walks away with outsized gains, potentially well after departure, since many of these shares vest over time.
The paper's data can't distinguish between these two stories. A CEO who sandbagged and then unleashed would show the exact same pattern: high relative pay risk during the measurement window, followed by strong stock returns afterward.
You'd need to test whether performance is suspiciously back-loaded, whether R&D and capex patterns look different, or whether the effect is stronger for CEOs approaching known departure dates.
The bottom line
For stock pickers: This gives you a quantitative pay factor you can plug into multi-factor models. The inputs are now in every public company's proxy. Test it against standard factors before sizing positions.
For institutional investors: The framework turns say-on-pay voting from a checkbox exercise into a rigorous evaluation. A negative predicted return from pay dimensions is a concrete reason to vote no.
For hedge funds: The long/short results – 21% annualized return on margin capital over 3 years – suggest the market still underreacts to CEO pay structure. That mispricing should persist as long as boards and proxy advisors keep using the wrong metrics. One caveat: until someone runs this through a full factor model, the true standalone alpha remains an open question.
2. How to separate the best bond funds from the worst (and there’s a big gap!)
Detecting Skilled Bond Fund Managers (February 18, 2026) - Link to paper
TLDR
A long-short strategy buying the top 10% and selling the bottom 10% of bond funds, ranked by ML-predicted alpha, earned 30 basis points per month with a 0.85 annualized information ratio over nearly 30 years.
For context: IR >0.5 is considered “good” and most active bond fund managers deliver IRs in the 0.1-0.3 range net of fees, if positive at all.
Past fund returns and abnormal returns are the key predictors of future performance – not what bonds the fund holds.
What the authors did
They assembled a dataset of 3,021 unique U.S. bond mutual funds from May 1995 through November 2024.
First, they defined each fund's abnormal return by regressing gross fund returns against a seven-factor model spanning government bonds, corporate high-yield, municipal bonds, and ABS/MBS/CMBS. This factor model explains 89% of fund return variation on average – what's left is the fund's alpha.
Then, they trained an ML model on 50+ fund-level and macroeconomic variables to predict which funds would generate the highest and lowest alpha next month. Each month, they ranked funds into deciles by predicted abnormal return and tracked realized performance.
What they found
The top decile of predicted funds earned +34% cumulative abnormal return over 355 months. The bottom decile lost -73%. A theoretical long-short portfolio combining both sides generated 107.3% cumulative alpha, or ~30 basis points per month with a monthly information ratio of 24.6% (0.85 annualized). Two-thirds of this spread came from avoiding the worst funds, not from picking the best.
The surprise: holdings data doesn't help
When the authors stripped out all holdings-based characteristics and used only fund-level and family-level features, the long-short portfolio still earned 108.4% cumulative alpha. But when they used only holdings data, the portfolio was essentially flat at 14.5%.
You cannot detect a skilled bond manager by looking at what they own. The signal lives in how the fund has performed – its momentum, reversal, and abnormal return patterns– not in its portfolio composition.
This is counter-intuitive and provocative… implying that past performance predicts future performance.
The standard claim rests on decades of equity mutual fund research (Jensen, Carhart, Fama & French) showing that the average active manager doesn't persistently beat benchmarks. That finding still holds here. The average bond fund in this sample has roughly zero alpha. Most managers are mediocre.
What this paper shows is different: a nonlinear ML model combining many signals can separate the extremes out of sample. It's not just "buy last year's top performers." A simple univariate momentum sort gives you a monthly IR of about 0.15 (decent but not spectacular). The ML model gets higher predictive power by combining momentum at multiple horizons, reversal patterns, abnormal return persistence, and macro conditions in ways that interact nonlinearly. No single variable does the job. The ensemble does.
Where skill concentrates
The model works best for corporate and municipal bond funds, where information asymmetry and market segmentation create room for managers to add value. Corporate bond funds showed 116.6% cumulative alpha on the long-short portfolio (IR: 17.3% monthly), and muni funds showed 90.4% (IR: 18.4% monthly). Treasury bond funds, by contrast, showed weak differentiation – there's simply less room for skill in the most liquid, homogeneous market.
The bottom line
For allocators and fund selectors in fixed income, this paper’s message is: track fund-level performance patterns, not portfolio holdings. An ML model using past returns, abnormal return momentum, and macro conditions can separate winners from losers, and the signal is durable enough that you don't need to trade frequently.
3. Research-grounded Investor Q&A: “Does managerial pedigree predict stock performance?”
Undergraduate and MBA degrees from elite schools show no reliable link to stock returns or operating performance. The one credential that does predict is the PhD, and the real alpha signal isn't where any individual went to school, but whether the management team is cognitively diverse or homogeneous.
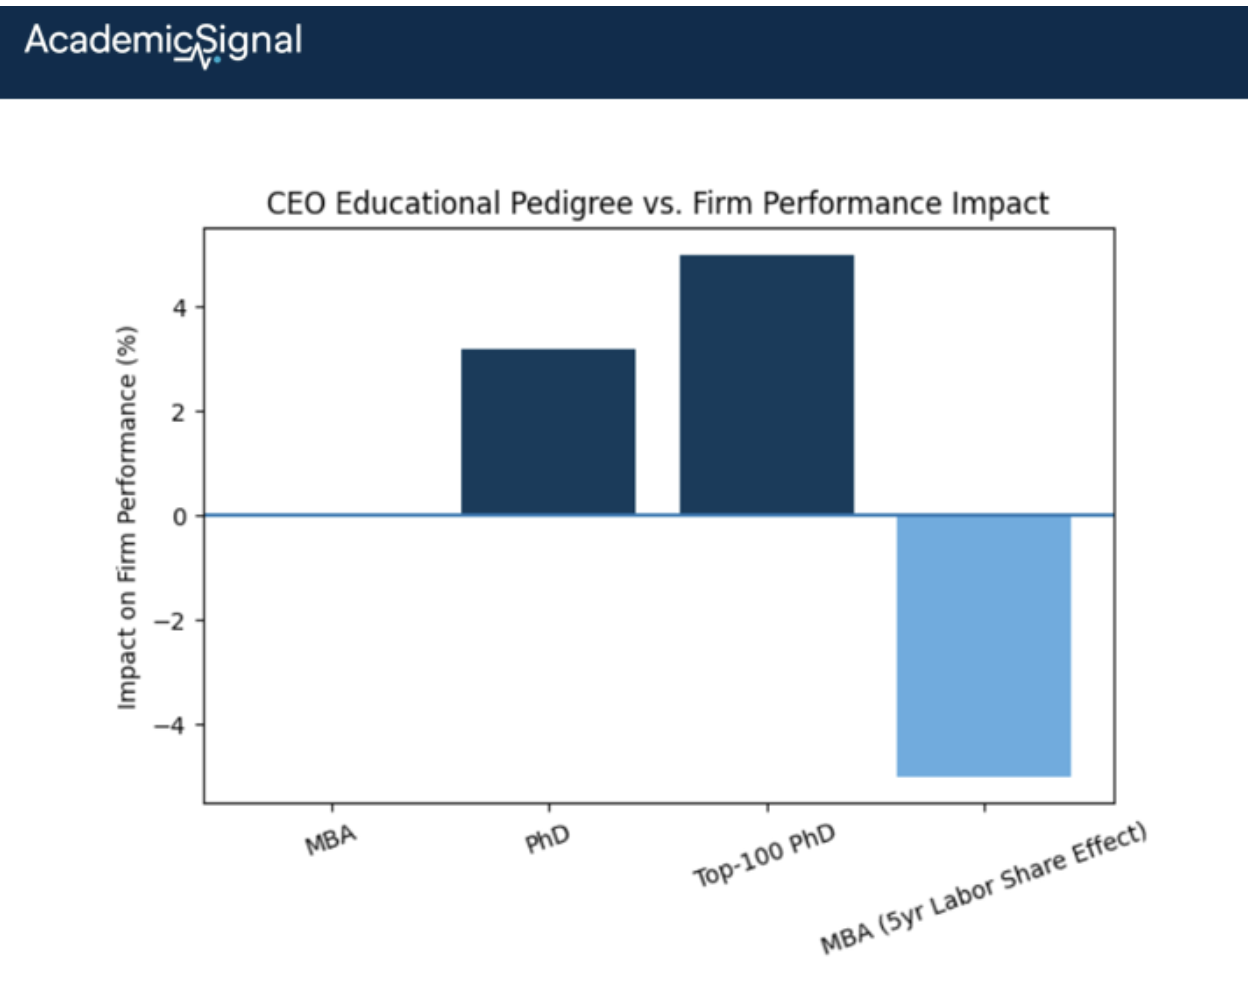
The MBA is a non-signal for firm performance. The most comprehensive recent study is Urquhart and Zhang (2022). Studying all FTSE 350 firms from 1999–2017, they find that CEOs with undergraduate, postgraduate, or MBA-level education offer no explanatory power when predicting firm performance. The sole exception: CEOs with PhDs increase firm performance by 3.2%, and those with PhDs from top-100 universities boost it by 5%. The mechanism isn't strategic vision or network access – it's cost discipline. PhD CEOs improve margins through tighter expense control, not revenue growth or R&D spending. The result survives propensity score matching, ruling out the possibility that better firms simply hire PhD CEOs.
Elite education doesn't help, until the CEO starts doing deals. A recent study by Chen, Chen, and Lu (2025) examines 396 M&A transactions by Taiwanese listed firms from 2007–2020, classifying CEOs as "elite-educated" if they graduated from a top-30 global or top-30 domestic university. Elite-educated acquiring CEOs generate significantly higher 3-day cumulative abnormal returns around M&A announcements. The mechanism here is human capital signaling: the market interprets elite credentials as a proxy for deal execution competence. But this is an announcement effect – it measures what the market believes about pedigreed CEOs, not what those CEOs actually deliver over time.
At scale, MBA CEOs actively destroy value. Acemoglu, He, and le Maire (2022, revised 2025), in a landmark NBER working paper, provide causal evidence that within five years of appointing a CEO with a business degree, employee wages decline by 6% and the labor share falls by 5 percentage points in the U.S. (3% and 3pp in Denmark), with no corresponding improvement in output, investment, or employment growth.
The share of S&P CEOs holding business degrees has risen from 23% in 1981 to 39% in 2019, with Harvard Business School alone producing 19% of them. Using instrumental variables (board composition) and manager retirement/death events, the authors establish this is causal.
MBA CEOs improve accounting profitability, but entirely through labor cost reduction, not through growing the business. For equity investors, this means pedigree signals a management style (cost-cutting, shareholder-value maximization) rather than a performance edge.
What actually predicts firm performance is management team diversity. Wagdi and Fathi (2024) study 70 non-financial corporations across seven emerging markets from 2013-2022 and find that TMT diversity based on education and nationality has a significant positive impact on both firm performance (ROA, ROE) and firm value (Tobin's Q and stock returns). Gender diversity alone does not move the needle. The education effect is specifically about heterogeneity: teams where executives come from different academic disciplines and institutional backgrounds outperform teams of uniform pedigree.
The broader research context: boards use pedigree as a hiring signal, but the signal doesn't translate to long-run stock performance. Bhagat, Bolton, and Subramanian (2010), analyzing 14,500+ CEO-years across the S&P 1500, found that CEO education plays a significant role in selecting replacement CEOs but has no systematic relationship with long-term firm performance across 22 different education measures and three performance metrics. The market briefly reacts positively to the appointment of better-credentialed CEOs but those announcement returns don't persist.
Why does this matter for stock pickers? The evidence points to a clear framework. Pedigree predicts management style – MBA CEOs lean toward cost-cutting, M&A activity, and shareholder-value rhetoric – but not firm-level alpha. The one credential with a genuine performance link is the PhD (+3.2–5%), likely because the research training instills analytical rigor and cost discipline rather than the deal-making orientation MBA programs emphasize. For investors screening management teams, the actionable signal is cognitive diversity across the C-suite (varied educational backgrounds, disciplines, and institutional origins), which predicts both firm performance and firm value across multiple studies.
Disclaimer
This publication is for informational and educational purposes only. It is not investment, legal, tax, or accounting advice, and it is not an offer to buy or sell any security. Investing involves risk, including loss of principal. Past performance does not guarantee future results. Data and opinions are based on sources believed to be reliable, but accuracy and completeness are not guaranteed. You are responsible for your own investment decisions. If you need advice for your situation, consult a qualified professional.