
Dr. Copper, $7T on Autopilot, and the Rate Myth

Hey, I’m KP and thank you for joining 45,000+ professional investors reading my weekly newsletter. Each week, I work with PhDs to translate top-tier finance research into plain English — revealing evidence-based ideas that matter to professional investors, analysts, and CIOs.
In this week’s report:
Research-grounded Investor Q&A: “Does copper or other industrial metals actually lead equity markets, or is 'Dr. Copper' folklore?”
$7 trillion in "autopilot" funds permanently inflates stock prices, and you can't bet against it
Only one-third of the interest rate decline has actually boosted stock prices
Want your own OpenClaw AI analyst delivering intelligence to your Slack, without the setup headaches or security risks? We built a done-for-you solution with professional investment workflows already in place.
Want to test it? Reply with 5 tickers you’d like to monitor and I’ll email you the alerts (No login, no setup, no API keys.)
1. Research-grounded Investor Q&A: “Does copper or other industrial metals actually lead equity markets, or is 'Dr. Copper' folklore?”
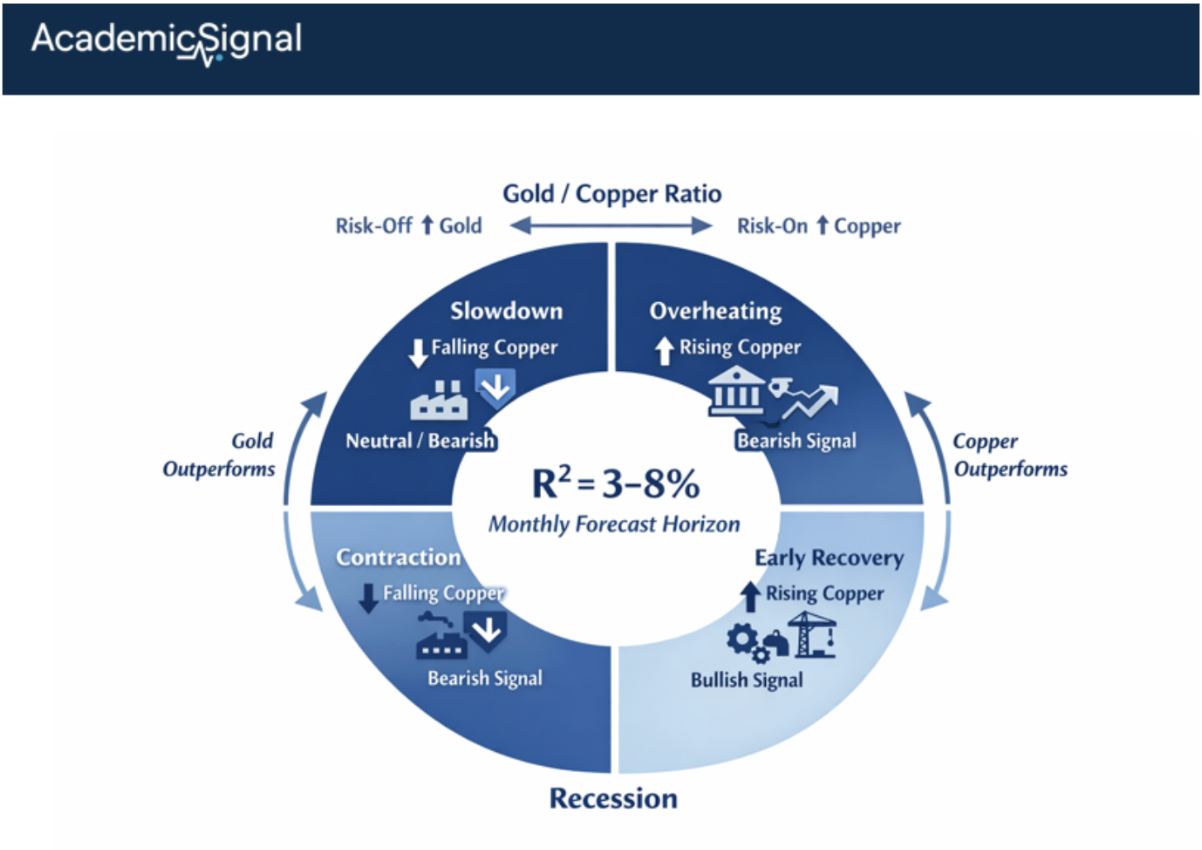
"Dr. Copper" is real. But the relationship is nuanced and the direction of the signal flips depending on where you are in the business cycle.
Jacobsen, Marshall & Visaltanachoti’s (2019) key insight: industrial metals like copper and aluminum do predict equity returns, but the effect is state-dependent. A one standard deviation increase in industrial metal returns predicts a 1.5% drop in monthly stock market returns during expansions and a 0.5% increase during recessions. The out-of-sample R² ranges from 3% to 8%, stronger than many established equity return predictors like dividend yield.
Why the Sign Flips
During expansions, rising copper prices signal overheating demand that compresses corporate margins (input costs rise faster than pricing power) and portends tighter monetary policy. The equity market reads copper strength as "peak cycle" risk. During recessions, rising copper prices signal the early stages of recovery – increased industrial production, infrastructure spending ramping up – before official economic data confirms the turn. The intuition: commodity markets price physical demand faster than equity markets discount future earnings.
The Gold-to-Copper Ratio: A Refinement
Recent work by Roh, Kim, Yoon & You (2025) examines the gold-to-copper ratio; a single metric that captures both risk aversion (gold) and growth expectations (copper). They find that the gold-to-copper ratio demonstrates robust predictive power for 3-month to 12-month stock returns across developed markets and global equities. Predictability increases during recessions (consistent with gold's safe-haven role) but persists even during expansions because copper's demand sensitivity captures real economic momentum.
The intuition: when gold outpaces copper, investors are prioritizing safety over growth bets – a bearish signal for equities. When copper outpaces gold, capital is flowing toward industrial exposure – a bullish signal, at least until copper prices peak and expansion-phase dynamics take over.
The Mechanism: Gradual Information Diffusion
Why doesn't the equity market immediately price this commodity information? The leading explanation comes from Hong & Stein's (1999) gradual information diffusion hypothesis. Commodity markets are dominated by industrial consumers, commodity trading advisors, and macro-focused funds who process physical demand data in real-time. Equity investors – retail and many institutional allocators – focus on company-specific information and react to macroeconomic shifts with a lag. Valcarel et al. (2017) document that commodity data can predict U.S. industry equity returns more than four trading weeks ahead, consistent with information slowly migrating from commodity desks to equity analysts.
Implementation Considerations
Signal construction: Track a basket of industrial metals (copper, aluminum, zinc) rather than copper alone. Diversification reduces noise from idiosyncratic supply disruptions (Chilean mine strikes, Chinese smelter closures).
State identification: You need a regime classification such as the unemployment rate trajectory, ISM manufacturing, or the Conference Board's leading economic index.
Holding period: The predictability operates at monthly horizons. This is not a day-trading signal.
Signal decay: As with any publicly documented anomaly, crowding is a risk. However, the state-dependent nature (requiring correct regime identification) creates implementation complexity that may preserve some alpha.
The Bottom Line
Dr. Copper isn't folklore. It's empirically validated as a leading indicator for equity returns, but the market-timing application requires understanding which phase of the cycle you're in. Rising copper during a recession is bullish for stocks; rising copper during a late-stage expansion is a warning sign. The gold-to-copper ratio offers a cleaner single metric that captures both dynamics simultaneously. Monthly out-of-sample R² of 3-8% is strong by equity premium prediction standards, where most variables fail to beat a simple historical mean forecast.
2. $7 trillion in "autopilot" funds permanently inflates stock prices, and you can't bet against it
Asset Pricing with Dynamic and Static Investors (Feb 23, 2026) - Link to paper
TLDR
Target-date funds, balanced funds, and similar vehicles keep a fixed percentage in stocks no matter what, creating persistent buying pressure worth trillions
This isn't a mispricing you can exploit: these funds never exit, so there's no convergence to bet on
The effect intensifies during downturns, exactly when stocks look cheapest
The takeaway
About $7 trillion sits in funds that maintain fixed stock allocations (say, 60% equities) regardless of valuations, earnings, or market conditions. This "static" money bids up stock prices above what dividends alone would justify.
Here's the catch: you can't profit by shorting this away. These funds keep buying forever. There's no moment when prices snap back to fundamentals because the buyers never leave.
How it works
Think of two investor types. Dynamic investors (hedge funds, active managers) adjust their portfolios based on news. When stocks look bad, they sell. Static investors (target-date funds, balanced funds) follow a rule: always hold X% in stocks. Good times or bad, they keep buying.
Because static investors are completely predictable, their future demand gets priced in today. The market knows they'll show up tomorrow, next month, next decade. That certainty supports prices permanently.
Why it's worse in bad times
When expected returns drop, dynamic investors flee to bonds. But static funds hold firm at their target allocation. With fewer fundamental-focused buyers in the market, the static money becomes the dominant force setting prices.
The data backs this up: static fund ownership rises precisely when risk-adjusted returns deteriorate. They own more of the market exactly when it looks least attractive.
The bottom line
Before betting against "overvalued" stocks, ask: who's on the other side? If trillions in autopilot money will keep buying regardless, you're not exploiting a mispricing, you're fighting a permanent structural force.
For value investors expecting mean reversion: this pressure is strongest when markets look cheapest. That's not a coincidence. It's the mechanism.
3. Only one-third of the interest rate decline has actually boosted stock prices
Interest Rates and Equity Valuations (Feb 23, 2026) - Link to paper
TLDR
Falling rates don't automatically lift stocks; it depends on why rates fell
Only "pure discounting" rate changes pass through to equities; growth and risk changes cancel out
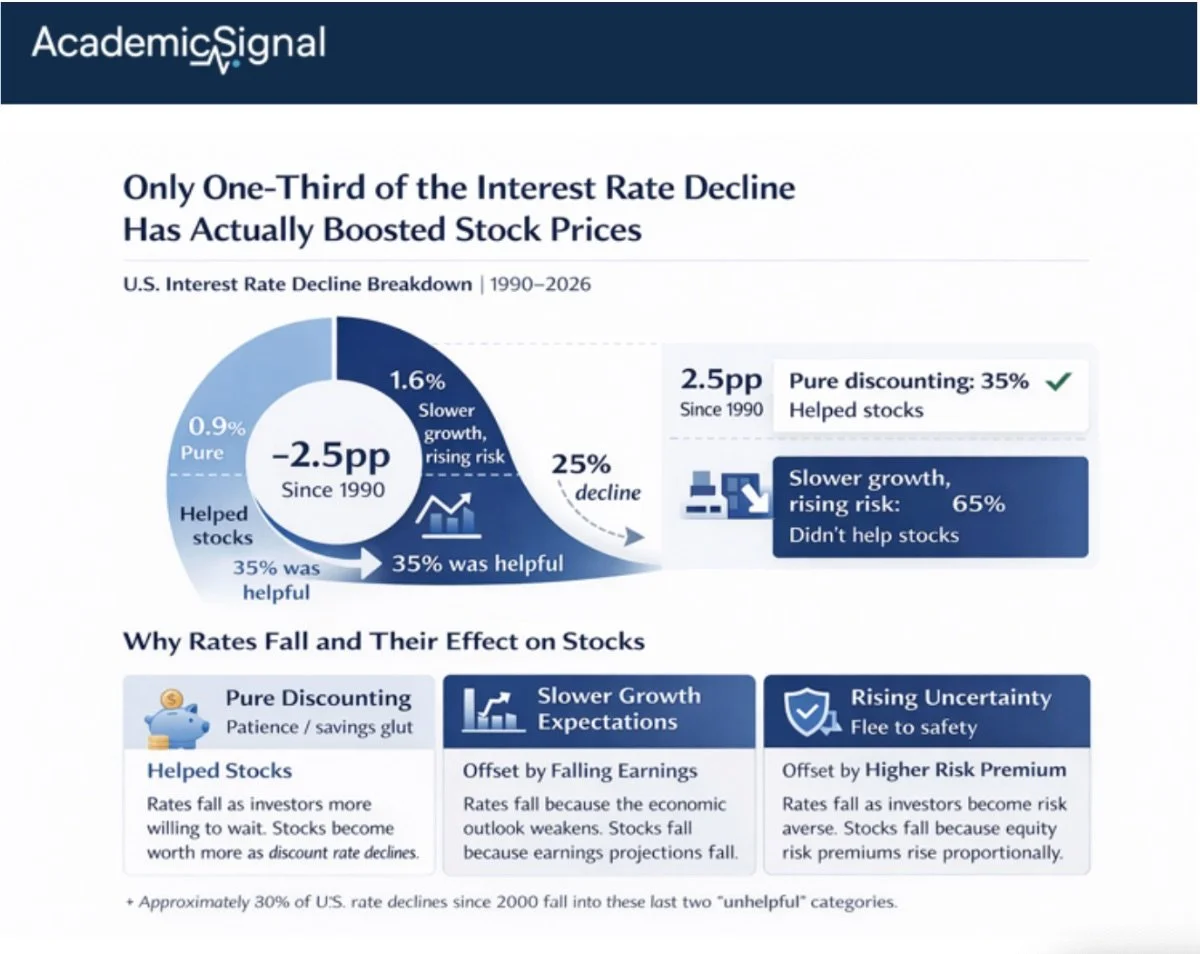
Just 35% of the U.S. rate decline since 1990 was the helpful kind
The takeaway
Most investors assume lower interest rates mean higher stock prices. The math seems obvious: stocks are claims on future cash, lower rates make future cash worth more, so stocks rise.
But across G7 countries since 1990, there's essentially zero correlation between falling rates and rising stock valuations. This matters for anyone building rate scenarios into their portfolio strategy.
Why rates fall matters more than how much they fall
Interest rates can drop for three different reasons, and each affects stocks differently:
Pure discounting shifts (patience/savings glut): Rates fall because investors become more willing to wait. This passes through 100% to stock prices.
Slower growth expectations: Rates fall because the economy looks weaker. The lower discount rate is offset by lower expected earnings. Net effect: zero.
Rising uncertainty: Rates fall as investors flee to safety. But equity risk premiums rise by roughly the same amount. Net effect: zero.
What the data shows
The authors decompose rate changes using growth forecasts and VIX data across 12 countries from 1990–2023. The results:
Pure discounting explains 80% of cross-country valuation differences (with a near-perfect 1:1 relationship)
Raw rate changes explain nothing (R² = -0.02)
In the U.S., the 2.5 percentage point rate decline breaks down as:
~0.9 pp from pure discounting (helped stocks)
~1.6 pp from weaker growth and higher risk (didn't help stocks)
Most of the helpful decline happened in the 1990s. Since 2000, pure discounting has been flat, meaning the continued rate decline delivered almost no valuation boost.
The bottom line
When building interest rate scenarios, don't assume rate moves flow through to equities one-for-one. Ask what's driving the rate change. Demographic shifts and capital flows (pure discounting) help stocks. Growth slowdowns and risk spikes don't.
Disclaimer
This publication is for informational and educational purposes only. It is not investment, legal, tax, or accounting advice, and it is not an offer to buy or sell any security. Investing involves risk, including loss of principal. Past performance does not guarantee future results. Data and opinions are based on sources believed to be reliable, but accuracy and completeness are not guaranteed. You are responsible for your own investment decisions. If you need advice for your situation, consult a qualified professional.