
Most thematic ETFs are just expensive beta bets… here’s how to fix it
In this week’s report:
Most thematic ETFs are just expensive beta bets… here’s how to fix it
Why early outperformance of hedge funds using AI has all but disappeared
1. Most thematic ETFs are just expensive beta bets… here’s how to fix it
Thematic Investing in Total Portfolio Factor Lens (October 25, 2025) - Link to paper
TLDR
What the authors did: They took the constituents of thematic ETFs, decomposed their factor betas, and showed that there’s barely any ‘thematic’ beta, meaning all the volatility is attributed to non-thematic factor exposures, e.g., sector, momentum, etc.
What they showed: Popular thematic ETFs barely deliver actual thematic exposure. For example, AIQ's 10% tracking error contains only 0.33% from AI, while ARKK's 18.85% tracking error contains 0% from five major tech themes.
How they solve this problem: By sourcing thematic stocks using news narrative data, and then isolating true thematic exposure by mathematically separating what's genuinely unique to themes from what's just repackaged industry, style, and beta exposures.
The problem with thematic investing today
Thematic investing is largely broken. Investors pay premium fees for "AI exposure" or "innovation exposure," but what are they actually getting?
The authors analyzed two popular thematic ETFs as case studies:
Global X AI & Technology ETF (AIQ): 85 holdings, 68 bps expense ratio
ARK Innovation ETF (ARKK): 40 holdings, 75 bps expense ratio
They found that these funds barely expose investors to the themes they claim to target. Instead, they're expensive bets on market beta, industry concentration, and style factors – exposures you could replicate with cheap index funds.
The Foundation: Understanding tracking error
Before diving into the methodology, let's establish what tracking error means and why it matters for this analysis.
Tracking error measures how much a portfolio's returns deviate from its benchmark. Think of it as the volatility of your "active bets."
Simple example:
Year 1: Benchmark +15%, Your portfolio +18% → Difference: +3%
Year 2: Benchmark +10%, Your portfolio +8% → Difference: -2%
Year 3: Benchmark +5%, Your portfolio +12% → Difference: +7%
Tracking error = standard deviation of those differences ≈ 4.5%

What the numbers mean:
1-3% tracking error: Staying close to benchmark (index-like)
5-10% tracking error: Moderate active bets
15%+ tracking error: Aggressive, concentrated positions
The critical question: If you're taking 10% or 20% of tracking error, what's driving that risk? Is it the thematic exposure you paid for, or unintended factor bets?
The authors’ approach: Using narrative data
The authors use "narrative data" from RavenPack to quantify thematic exposures. This isn't some hand-wavy sentiment analysis; it's a systematic process for measuring how intensely companies are discussed in thematic contexts.
How RavenPack Works
RavenPack processes millions of news articles daily, identifying:
Company entities (e.g., NVIDIA, Tesla, Microsoft)
Theme entities (e.g., Artificial Intelligence, Blockchain, Robotics)
Relevance scores (0-100 scale for how central each entity is to the story)
Calculating Raw Theme Exposures
Step 1: Count High-Quality Articles
Only count articles where BOTH the company AND theme have ≥90% relevance scores. This filtering ensures they're capturing genuine thematic focus, not passing mentions.
Example for NVIDIA in a given month:
Total articles mentioning NVIDIA: 150
Articles where NVIDIA ≥90% relevance AND AI ≥90% relevance: 45
Articles where NVIDIA ≥90% relevance AND Cloud ≥90% relevance: 12
Step 2: Calculate Term Frequency (TF)
TF = (Theme articles) / Max(50, Total articles)
Using 36-month rolling averages to smooth noise. For NVIDIA:
AI Term Frequency = 45/150 = 0.30
Cloud Term Frequency = 12/150 = 0.08
Step 3: Normalize to 0-1 Scale
Across all stocks in MSCI ACWI:
Score = (TF - min(TF)) / (max(TF) - min(TF))
After winsorizing at the top 5% and bottom 1% to remove outliers, they normalized the data so every stock gets a score from 0.0 to 1.0 for each theme, updated monthly.
Why This Beats Traditional Labeling
Traditional approach: "Is this an AI company?" → Binary yes/no based on business description
Narrative approach: "How intensely is this company discussed in AI contexts?" → Continuous measure that:
Captures emerging exposure before it shows up in revenue
Tracks intensity (NVIDIA gets 0.80, a company with one AI project gets 0.15)
Updates dynamically as narratives evolve
Finds cross-sector themes (discovers AI in healthcare, finance, retail)
Real example from the paper:
AI theme's overlap with conventional factors (adjusted R-squared):
2017: 18% overlap with semiconductor/software industries
2020: 37% overlap
March 2023: 32% (GPT-4 launch)
2025: 65% overlap
The AI narrative evolved from broad to concentrated in specific industries. Static labels would miss this.
Separating Signal from Noise: The Orthogonalization Process
Here's where the mathematical rigor comes in. The authors need to separate genuine thematic exposure from what's just industry/style beta in disguise.
Imagine NVIDIA has a raw AI narrative score of 0.80. But NVIDIA is also:
A semiconductor company (industry factor)
High-growth stock (style factor)
High-momentum stock (style factor)
High-beta stock (market factor)
The question: Is NVIDIA's AI score genuinely about AI, or is it just a reflection of being a high-growth semiconductor stock that's been rallying?
The Mathematical Solution
For each stock and each theme, they run a regression:
Raw_Theme_Score = β₀ + β₁(Industry factors) + β₂(Style factors) + β₃(Beta) + ε
For NVIDIA's AI score:
0.80 = β₀ + β₁(Semiconductor) + β₂(Software) + β₃(Growth) + β₄(Momentum) + β₅(Beta) + ε
Let's say the regression shows:
Predicted AI score from conventional factors: 0.75
Residual (ε): 0.05
That residual (0.05) becomes NVIDIA's "orthogonalized AI exposure" = the unique AI component not explained by industry/style/beta.
Translation: "Of NVIDIA's 0.80 AI narrative score, 94% is explained by it being a high-growth semiconductor company. Only 6% is unique AI exposure."
The key insight: Stocks with lower raw thematic scores can have MORE genuine AI exposure after accounting for industry/style overlap.
If you build an "AI portfolio" using raw scores, you may end up overweighting semiconductor giants and end up with an expensive semiconductor fund, not an AI fund.
If you use orthogonalized scores, you'll find stocks with genuine AI exposure independent of industry concentration, actually delivering the thematic tilt you want.
Decomposing a portfolio’s risk sources
To measure how much of a portfolio's tracking error comes from each source, the authors don't run a regression of returns. Instead, they use a holdings-based decomposition:
Step 1: Take actual holdings (AIQ's 85 stocks, ARKK's 40 stocks) as of June 30, 2025
Step 2: Look up each stock's factor exposures from MSCI Barra risk model
Tesla: Beta=1.80, Momentum=2.30, Growth=1.50, Auto Industry=0.80
Coinbase: Beta=2.10, Volatility=3.20, Financial Services=0.90
...and orthogonalized theme exposures from their analysis
Step 3: Calculate portfolio-level exposures
Portfolio Beta = Σ(weight_i × Beta_i)
Portfolio AI_orthogonalized = Σ(weight_i × AI_orthogonalized_i)
Step 4: Use the augmented covariance matrix to compute variance contributions
The authors build a comprehensive covariance matrix that includes:
62 vendor factors from MSCI Barra (1 beta + 16 style + 45 industry + country + currency)
5 orthogonalized theme factors
Stock-specific variances
Total tracking error variance:
TE² = (Vendor factor variance) + (Theme variance) + (Interaction terms) + (Stock-specific variance)
Each component's contribution is calculated using the full covariance structure, accounting for correlations between factors.
The results for thematic ETFs
AIQ ETF (AI-Themed)
Total tracking error: 10.34%
Where it comes from:
Global Equity Market beta factor: 4.00% (largest component)
Industry factors: 3.27% (semiconductor/software concentration)
Stock-specific: 0.94%
Style factors: 0.90%
Country/Currency: 0.44%
AI theme: 0.33% (only 3% of total variance!)
All 5 themes combined: 0.45%
Translation: You're paying 68 bps for a portfolio where 97% of the tracking error comes from beta and industry bets, not AI.
ARKK ETF (Multi-Thematic "Innovation")
Total tracking error: 18.85%
Where it comes from:
Beta factor: 8.84% (massive market sensitivity)
Style factors: 4.51% (growth, momentum, liquidity)
Stock-specific: 2.61% (concentrated positions)
Industry factors: 0.74%
All 5 themes combined: ~0% (effectively zero!)
Translation: Despite holding stocks like Tesla (robots), Coinbase (blockchain), and Roku (cloud), ARKK delivers exactly 0% exposure to these themes after accounting for conventional factors.
Why? Those companies' thematic narrative scores are almost entirely explained by their industry and style factor exposures. After orthogonalization, nothing unique remains.
What’s the solution? Orthogonalized theme exposures
Using the above framework, the authors demonstrate how to build portfolios with genuine thematic exposure = find companies with narrative exposure to a theme, and then run regressions against all factors to single out those that have true thematic exposure.
Results: AI Thematic Portfolio
Total tracking error: 1.99% (more controlled than AIQ's 10.34%)
Where it comes from:
AI theme: 1.22% (61% of total risk, indicating genuine AI exposure)
Other themes: 0.35%
Stock-specific: 0.56%
Beta: ~0% (by design)
Style factors: ~0% (by design)
Industry factors: ~0% (by design)
Holdings: ~220 stocks (vs. AIQ's 85), more diversified, targeting stocks with high orthogonalized AI scores regardless of industry.
Performance Comparison
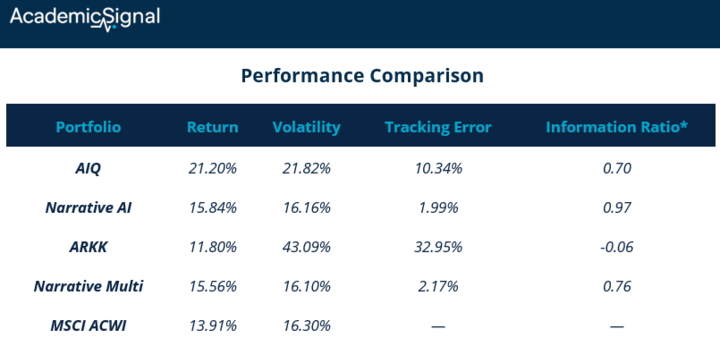
* Information Ratio (IR) = (Active Return) / (Tracking Error) – measures return per unit of risk taken.
Key takeaways:
Narrative portfolios deliver better risk-adjusted returns (higher IR)
Narrative portfolios achieve this with 5-15x lower tracking error
ARKK took massive risk (33% TE) and lost money (-0.06 IR)
AIQ's 0.70 IR looks okay until you realize 97% of its risk is unintended
If you're investing in thematic ETFs…
Do this analysis:
Get the current holdings
Run them through a holdings-based risk decomposition
Check what percentage of tracking error comes from themes vs. factors
You'll likely find you're paying 60-75 bps for factor exposures you could replicate with a combination of:
Low-cost beta exposure (S&P 500 ETF at 3 bps)
Factor ETFs (momentum, growth at 15-25 bps)
Sector ETFs (technology at 10-15 bps)
2. Why early outperformance of hedge funds using AI has all but disappeared
The Growth and Performance of Artificial Intelligence in Asset Management (October 29, 2025) - Link to paper
TLDR
AI-driven hedge funds generated 5% annual alpha over non-AI funds before 2017, but this edge has completely vanished
The performance decay tracks directly with industry growth: AI fund count quadrupled since 2012, creating crowded trades
AI funds still beat their sibling funds at the same adviser, suggesting the technology works but scale kills the edge
What the authors did
They analyzed 6,890 US hedge funds from 2006-2024, using machine learning to identify which funds actually deploy AI in investment decisions (not just marketing talk). They found only 106 true AI funds (~1% of the universe) with 88% of AI fund assets concentrated in systematic macro strategies.
The core finding: AI funds delivered significant outperformance early on, then lost their edge as more capital piled in. This isn't a story about AI failing – it's a textbook case of alpha decay through competitive exploitation.
How they identified real AI funds
The researchers used GPT-5 to analyze thousands of fund strategy descriptions from the HFR database's annual snapshots (avoiding look-ahead bias). They required explicit mentions of machine learning, neural networks, or other adaptive AI techniques, filtering out generic "quantitative" or "systematic" language.
They cross-validated this by examining investment advisers' AI-related job postings from 2010-2024. Advisers managing AI funds showed significantly higher AI hiring, particularly for investment and IT roles. This labor-market validation confirms the funds aren't just using AI buzzwords.
The alpha lifecycle in numbers
Pre-2017 performance was striking: AI funds generated 45 basis points monthly alpha (5.4% annually) using Fung-Hsieh factors, after controlling for fund size, age, fees, and strategy. Post-2017, this alpha disappeared entirely.
This wasn't about early adopters being smarter. Even funds that launched before 2017 lost their edge in subsequent years. The culprit: scale and crowding. AI fund count grew 4x since 2012, while co-movement among AI funds ran significantly higher than non-AI funds until 2021.
The crowding shows up clearly in the data. AI funds' pairwise return correlations and principal component analysis both indicate they're trading similar signals.
As more funds deployed comparable models on the same liquid macro instruments, the opportunity set got arbitraged away.
Where AI still works
The within-adviser comparison reveals the technology's persistent value. AI funds outperformed sibling funds managed by the same adviser by 41 basis points monthly throughout the sample period, with some outperformance continuing even after 2018.
This suggests two things:
AI does provide a genuine edge over traditional discretionary approaches, and
the resource allocation toward AI initiatives may come at a cost to the adviser's other funds.
Advisers facing stronger performance incentives – higher incentive fees, fewer high-water marks, shorter lockup periods – were significantly more likely to launch AI funds. A one-percentage-point increase in average incentive fees associates with a 13% higher likelihood of launching an AI fund the following year.
The bottom line
AI is not a magic bullet for alpha generation. It works, but only until too many funds chase the same signals in the same markets. The concentration in systematic macro (liquid futures, currencies, commodities) made the strategy especially vulnerable to crowding.
For allocators, the implications are clear: ask harder questions about differentiation. With 88% of AI fund assets in systematic macro, an AI fund needs to demonstrate genuine uniqueness, not just AI adoption.
Look for funds applying AI in less crowded spaces, those with proprietary data sources, or strategies with higher barriers to replication.
And for investors considering using AI for alpha generation, the implication is similar: can you access proprietary data sources, or do you have a strategy with higher barriers to replication?
The money flow data shows investors aren't blindly chasing AI marketing – flows track past performance, not AI labels. That's rational. The real question is whether new AI techniques can reignite differentiation, or whether scale dynamics will continue to compress any new edges.
For now, the evidence suggests AI is a necessary but not sufficient condition for alpha in systematic strategies… and being early matters more than you think.
Disclaimer
This publication is for informational and educational purposes only. It is not investment, legal, tax, or accounting advice, and it is not an offer to buy or sell any security. Investing involves risk, including loss of principal. Past performance does not guarantee future results. Data and opinions are based on sources believed to be reliable, but accuracy and completeness are not guaranteed. You are responsible for your own investment decisions. If you need advice for your situation, consult a qualified professional.