
Can You Really Hedge a Recession?
In this week’s report:
How to hedge against macro risks like recession, inflation, or a credit crisis
Continuation funds: Most LPs are getting the "Roll vs. Sell" decision wrong
1. How to hedge against recession, inflation, or a credit crisis (constructing tradable hedges for macro risks)
Growing Mimicking Portfolios: Estimating Nontraded Factor Risk Premia (November 17, 2025) - Link to paper
TLDR
Standard portfolios (like "Small Cap" or "Value") are too generic to track specific risks like inflation or banking crises.
The paper uses machine learning to build a "custom" portfolio that tracks the specific moves of these risks with much higher accuracy.
The Core Problem: You Can't Buy "Inflation" or "Recession"
Investors often want to hedge against big economic risks. The problem is: You cannot log into a brokerage account and buy 100 shares of "GDP Growth" or "Consumer Confidence." These are Nontraded Factors.
A Factor is simply a characteristic or trait that drives an investment's return.
Traded Factors are factors you can easily buy in the stock market. For example, historically, smaller companies tend to outperform larger ones over long periods. You can easily "buy" this factor by purchasing an ETF that holds only small companies (like the Russell 2000).
Nontraded Factors are broad economic forces or risks that affect asset prices but are not an asset. These are usually macroeconomic statistics or abstract concepts like GDP Growth or Consumer Confidence.
Since you can't buy "GDP Growth" directly, you have to mimic it.
How? If you’re worried about a recession (GDP going down), you need to find a basket of stocks that behaves exactly like GDP.
The Goal: You want a portfolio that goes up 1% every time GDP goes up 1%.
The Reality: This is incredibly hard to do. Most people just guess. They might say, "I'll buy Industrial stocks; they probably track GDP."
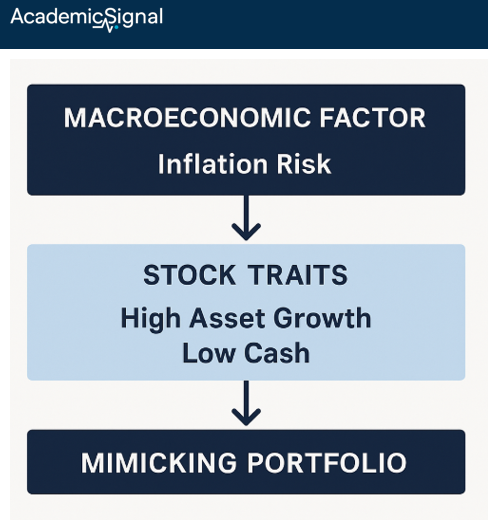
The paper uses machine learning to stop guessing. It scans thousands of stocks to find the perfect combination (e.g., "High Asset Growth companies + High Momentum companies") that creates a "synthetic" asset that moves in perfect lockstep with the nontraded factor. It turns a statistic into a tradable portfolio.
"Custom Tailoring" (The MPT)
The authors introduce the Mimicking Portfolio Tree (MPT). They use machine learning to build a custom bucket of stocks from scratch for each specific risk.
Imagine you have a bucket of 4,000 stocks and you want to sort them into piles to find the specific group that behaves exactly like "Inflation Risk." The MPT algorithm plays a high-speed game of "20 Questions" to do this.
The Starting Point (The Root): The model starts with a portfolio containing all available stocks.
The Search (The Split): The algorithm scans through dozens of firm characteristics (like Size, Momentum, or Profitability) and tests thousands of potential cut-off points. It asks hypothetical questions like:
"What if I split stocks into those with High Debt vs. Low Debt?"
"What if I split them by High Profitability vs. Low Profitability?"
The Decision (Maximize Correlation): For every possible split, it runs a test. It checks which split produces new portfolios that have the highest correlation with the target risk factor (e.g., Inflation).
Example: If splitting stocks by "Asset Growth" makes the resulting portfolio track Inflation perfectly, the model chooses that split.
The Growth (Recursive Partitioning): Once it makes the first split (creating two groups, or "nodes"), it repeats the process for each new group.
It might take the "High Asset Growth" group and further split it by "Momentum."
It continues this until it reaches a stopping point (like a maximum number of leaves or a minimum number of stocks per leaf).
The Result (Leaf Portfolios): You end up with a set of final "Leaf Portfolios". The algorithm then calculates the optimal weight for each leaf to build one master "Mimicking Portfolio" that tracks the nontraded risk factor as closely as mathematically possible.
Why It Makes Sense
The MPT approach makes sense because it solves the "Square Peg in a Round Hole" problem that plagues traditional finance.
1. Customization vs. Standardization
The Old Way (Standardization): Traditional models (like Fama-French) assume that every risk in the world can be explained by the same few things: Size and Value. This is like trying to treat every illness with aspirin. It works for some things, but not everything.
The MPT Way (Customization): MPT acknowledges that "Inflation Risk" might be driven by Asset Growth, while "Liquidity Risk" might be driven by Debt. It custom-builds the tool for the specific job.
2. Solving "Weak Identification"
When you use a generic portfolio (like "Small Cap Stocks") to track a specific risk (like "GDP"), the correlation is often very low (weak).
This "Weak Identification" breaks the math used to calculate risk premiums, leading to false results.
MPT fixes this by forcing the correlation to be high. By design, it hunts for the stocks that align with the risk, ensuring the signal is strong enough to be useful.
3. It Captures Nuance (Non-Linearity)
Simple sorting rules (e.g., "Buy Small Stocks") miss complex interactions.
MPT can find nuanced rules, such as: "Small stocks are only risky if they ALSO have low profitability". This allows it to capture economic realities that simple models miss.
Example from the Paper
The authors built a tree for "Intermediary Capital Risk" (a measure of banking sector health).
This is a measure derived from the aggregate balance sheets of primary dealers (major financial institutions). Specifically, it tracks the "shock" or unexpected change in the ratio of their capital to their assets.
When this ratio drops unexpectedly, it means the financial system's capacity to bear risk has shrunk (a "credit crunch"). When it rises, intermediaries are healthy and lending flows easily.
The Goal: The algorithm's job was to find a basket of stocks that crashes exactly when this balance sheet ratio crashes, and rallies exactly when the ratio improves.
The algorithm essentially ran a simulation for every potential split to see which one matched that target number best:
The Test: "If I group all stocks with High Leverage (Debt) together, does the monthly return of this group move up and down in sync with the Intermediary Capital Ratio?".
The Result: The algorithm found that Leverage was the single best predictor. Stocks with high leverage were extremely sensitive to shocks in intermediary capital.
Refining the Match: Once it isolated the high-leverage stocks, it looked for the next best characteristic to improve the correlation further. It selected Cash Holdings.
Why it makes sense: The model autonomously "learned" that to track banking risk, you need to focus on companies that are highly levered and cash-poor. A standard "Small Cap" portfolio would never have found this specific pocket of risk.
2. Continuation funds: Most LPs are getting the "Roll vs. Sell" decision wrong
Selling to Yourself: Continuation Funds in Private Equity (November 19, 2025) - Link to paper
TLDR
Winners, not lemons: Contrary to fears of adverse selection, GPs use continuation funds (CFs) to hold their strongest, largest assets, not to offload underperformers.
Skin in the game: GPs typically double their own capital commitment in CFs compared to legacy funds, signaling high conviction in future growth.
The LP exodus: Despite strong asset quality, 94% of legacy LPs choose to exit, largely due to bureaucratic friction rather than investment merit.
The Rise of "Selling to Yourself"
Continuation funds (CFs) – where a GP raises a new vehicle to buy assets from their own existing fund – have exploded from niche oddities to a dominant exit channel. In 2024 alone, CF volume hit $80 billion, nearly doubling the volume of IPOs.
For LPs, these transactions create a dilemma. The structure is rife with potential conflict: the GP sits on both sides of the table, negotiating the price and collecting fees. Is this a mechanism for GPs to "milk fees" from zombie assets, or an efficient way to maximize value in high-growth companies?
The paper analyzes the largest dataset of CFs to date (472 funds) to determine who wins, who loses, and why LPs are fleeing these vehicles.
Debunking the "Lemons" Hypothesis
The data strongly refutes the idea that GPs use CFs to hide bad assets. The authors find that CFs are overwhelmingly launched by high-performing managers. Specifically, legacy funds that launch CFs are significantly more likely to be "in the carry" (IRR > 8%) than those that do not.
The assets transferred are not random; they are typically the largest deals in the portfolio – the "crown jewels". Crucially, GPs put their money where their mouth is. The median GP ownership stake doubles from roughly 3% in the legacy fund to 6% in the continuation fund. GPs are rolling their carried interest into the new vehicle to capture future upside, effectively signaling that they believe the asset has significant room to run.
The LPs "Default to No"
Despite the high quality of these assets, legacy LPs are heading for the exits. The study reveals that only 5.7% of legacy investors choose to roll their stakes into the CF. This number has plummeted from ~30% for public pensions in 2018 to near zero in 2025.
The authors attribute this to institutional friction rather than asset pricing. LPs often lack the governance agility to approve a "re-underwriting" of a specific asset within the tight 3-month election windows typical of these deals. Consequently, public pensions are selling their stakes in high-performing assets to specialized secondary funds and private wealth platforms, who now make up 66% of new CF capital.
Performance Reality Check
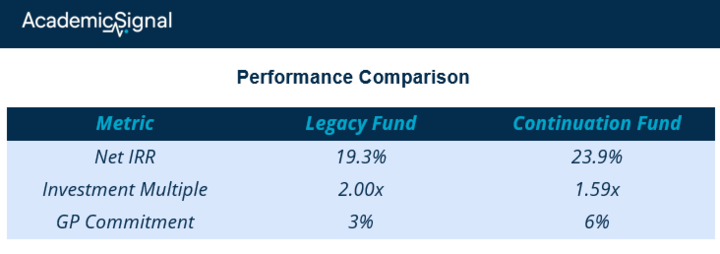
Do CFs actually deliver? Preliminary evidence suggests they hold their own. CFs report higher average Net IRRs (23.9%) than their legacy counterparts (19.3%), though they show lower multiples (1.59x vs 2.00x) due to the resetting of the investment clock.
There is no statistical evidence that CFs underperform peer funds. The narrative that CFs are a "fee trap" appears incorrect; they are a tool for duration management, allowing GPs to hold winners longer than the standard 10-year fund life permits.
The Bottom Line
The market for continuation funds is inefficient, but not in the way most investors assume. The inefficiency lies in the LP reaction function. Institutional investors are systematically selling stakes in high-conviction assets managed by aligned GPs because of internal liquidity mandates and slow approval processes.
Disclaimer
This publication is for informational and educational purposes only. It is not investment, legal, tax, or accounting advice, and it is not an offer to buy or sell any security. Investing involves risk, including loss of principal. Past performance does not guarantee future results. Data and opinions are based on sources believed to be reliable, but accuracy and completeness are not guaranteed. You are responsible for your own investment decisions. If you need advice for your situation, consult a qualified professional.