
When “Innovation” Becomes a Contrarian Signal
Hands-on AI workshops from CTOs and Heads of AI building the future of finance:
→ Scrape government websites for signals nobody's tracking
→ Build dashboards from alt-data you already have access to
→ Analyze industry news with automated read-throughs
Sign up for a free workshop at https://www.investmentanalyst.ai/
In this week’s report:
When innovation hype peaks, expect lower returns ahead
How correlated are AI equities and PE/CLO exposures? (more than you might think!)
Research-grounded Investor Q&A: “When the Fed surprises markets, how long does the drift last, and is there a tradeable pattern after FOMC announcements?”
1. When innovation hype peaks, expect lower returns ahead
One Hundred Years of Innovation Attention and Equity Risk Premium (January 14, 2026) - Link to paper
TLDR
A century of Wall Street Journal data reveals that elevated media attention on innovation predicts lower stock returns over the next 1-3 years
The signal delivers out-of-sample R² above 30% for tech stocks, which is exceptional in a field where most predictors fail to beat the historical average
Both fundamental shifts in future R&D activity and behavioral overreaction to innovation narratives drive the predictive power
What the authors did
The authors built an Innovation Attention (IA) index by applying machine learning to 2.9 million Wall Street Journal front-page articles spanning 1934-2022. Rather than relying on static keyword lists, they used Word2Vec embeddings to identify terms semantically related to innovation, capturing both explicit terminology and associated concepts like "experimentation" and "entrepreneurship."
They normalized monthly innovation word counts by total words published, creating a time series that tracks collective attention to technological progress across market cycles.
How the index behaves
The IA index captures major innovation waves: the PC revolution in the early 1980s, the dot-com boom around 2000, Web 2.0 and financial innovation in 2006, and recent AI developments. Media discourse about innovation rises during economic expansions and falls during recessions, reflecting when markets focus on growth narratives rather than defensive concerns.
Separately, the authors show that elevated innovation attention today predicts higher R&D spending and patent filings in subsequent periods. The index captures forward-looking information about real innovation investment, not just sentiment.
What they showed
Higher innovation attention today predicts lower excess market returns tomorrow. For the full 1934-2022 sample, in-sample R² rises from 0.76% at 3 months to 6.06% at 36 months. These numbers sound small but are meaningful in return prediction, where signal-to-noise ratios are notoriously low. Campbell and Thompson (2008) demonstrated that even 0.5% monthly R² translates to significant portfolio improvements. An in-sample R² above 2-3% at annual horizons is considered strong; 6% at three years is substantial.
The real test is out-of-sample performance – can the model predict returns it hasn't seen? Here the index delivers an average R² of 6.33% across horizons. For context: Goyal and Welch's landmark 2008 study showed most traditional predictors (dividend yield, earnings yield, term spread) fail to beat a naive historical average forecast out-of-sample. Many produce negative R². Any positive out-of-sample R² is useful; 6% is rather impressive.
The signal concentrates in innovation-intensive sectors. For information technology, out-of-sample R² reaches 30% at the 12-month horizon… exceptional by any standard. Communication services and consumer discretionary show similarly strong results. Energy and real estate show almost no predictive relationship.
Why it works
Two forces drive the signal. First, heightened innovation attention reflects genuine forward-looking information about future R&D and productivity growth. Second, a salience-driven component captures investor overreaction to innovation narratives. When decomposed, both components independently predict returns.
The effect amplifies during economic expansions and high-sentiment periods. Small-cap, high-beta, and high-volatility stocks show the strongest predictive relationships – precisely the securities most prone to attention-driven mispricing.
Practical implementation
The paper establishes a continuous relationship – higher attention correlates with lower subsequent returns – not a binary trading threshold. A one standard deviation increase in IA predicts roughly 4-8% lower cumulative returns over 12 months.
Key constraints: The index isn't publicly available. You'd need to replicate their Word2Vec methodology on news data or build a proxy using existing NLP sentiment services that track AI/tech mention frequency in financial media.
Realistic application: When your proxy shows innovation attention elevated relative to its own history (say, top quartile), you may set a rule to reduce tech overweights by 10-20%. Rebalance quarterly or semi-annually. The 12-36 month horizon means this is a strategic allocation tilt, not a tactical trading signal. Treat it as one input among several.
What to expect: The 3.1% annualized certainty-equivalent gain is real money, but it comes from consistent tilting over decades, not from calling tops. Even at 30% R², most variance remains unexplained. This improves your odds at the margin but it doesn't guarantee outcomes.
2. How correlated are AI equities and PE/CLO exposures? (more than you might think!)
The Link between the Use of Leveraged Buyouts and the AI Market Bubble and Its Implications for the US Economy (January 14, 2026) - Link to paper
TLDR
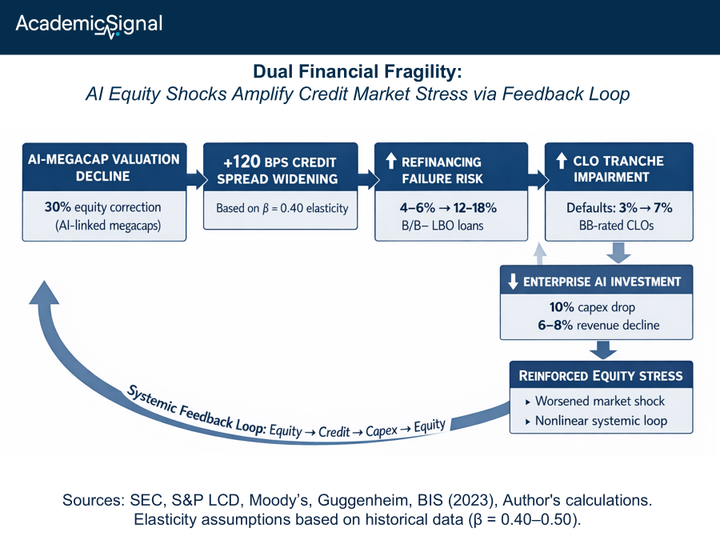
A 30% decline in AI megacaps widens leveraged loan spreads by 120 bps, pushing B-rated LBO refinancing failure rates from 6% to 18%
Credit stress and equity stress feed on each other: tighter credit cuts enterprise AI spending, which hammers hyperscaler earnings, which widens spreads further
CLO BB tranches hit impairment thresholds when default rates rise from 3% to 7% – a plausible outcome under severe AI correction scenarios
What the authors did
They built a stress-scenario framework linking AI-megacap equity drawdowns to leveraged loan spread movements using historical elasticities from prior macro-financial research. The goal: quantify how a correction in concentrated tech names transmits into private credit markets—and vice versa.
Their data pulls from SEC filings, S&P LCD, rating agency reports, and corporate bond issuance records. The leveraged loan market sits at $1.47 trillion, with CLOs holding 70-75% and covenant-lite structures comprising 80-85% of outstanding loans.
How they calibrated the transmission
The core relationship is simple: spread widening equals beta times equity decline. Using a baseline elasticity of 0.40 (consistent with Adrian & Shin 2010), they map equity corrections to credit stress:
Moderate stress: 30% equity decline → 120 bps spread widening
Severe stress: 50% equity decline at β=0.50 → 250 bps spread widening
They then layer in rating agency data on refinancing failure probabilities. When spreads widen 150-200 bps, B/B- rated LBO refinancing failures jump from 4-6% to 12-18%.
Why equity stress widens credit spreads
The paper treats the equity-to-credit link as an empirical regularity rather than unpacking the mechanism. But the likely channels are straightforward.
Risk-off contagion: when the S&P drops 30%+ led by its most concentrated names, institutional investors de-risk across asset classes. CLO and leveraged loan funds see outflows, spreads widen mechanically.
Shared macro drivers: the same forces that crush AI megacaps – rising rates, recession fears, valuation resets – hurt leveraged borrowers directly. Both markets respond to the same underlying shock.
Wealth and liquidity effects: institutions nursing equity losses reduce risk elsewhere or face redemptions, tightening credit availability across the board.
The feedback loop that amplifies both shocks
Here's where it gets dangerous for multi-asset portfolios. The authors document a 0.6-0.8 elasticity between enterprise capex and hyperscaler AI revenue. When credit tightens and leveraged borrowers pull back spending, cloud and AI infrastructure revenues take the hit: 6-8% revenue growth decline for every 10% drop in corporate capex.
That earnings pressure hammers the same AI megacaps that triggered the initial spread widening. NVIDIA alone carries 7-8% of the S&P 500; the top 10 names hold 38% of index weight. Credit stress weakens equity, equity stress widens credit, and the cycle accelerates.
Why covenant-lite structures make this worse
The 80-85% covenant-lite share removes early warning triggers. Lenders can't intervene until damage is done. By the time a refinancing fails, CLO tranches are already absorbing losses. The authors' tranche models show BB-rated CLO tranches approach impairment when portfolio defaults rise from 3% to 7% (well within their severe stress scenario).
The bottom line
The authors' framework suggests monitoring three things: the leveraged loan refinancing wall, megacap earnings sensitivity to enterprise spending, and your portfolio's net exposure to both legs of this trade. A 30% AI correction isn't a tail event. If it happens, expect your credit book to feel it within weeks.
3. Research-grounded Investor Q&A: “When the Fed surprises markets, how long does the drift last, and is there a tradeable pattern after FOMC announcements?”
Yes, the drift persists, but the duration and tradability vary dramatically by asset class and market conditions.
The Pre-FOMC Drift: Mostly Gone (Unless Volatility is High)
The original finding from Lucca & Moench (2015) documented 49 basis points of excess equity returns in the 24 hours before FOMC announcements, accounting for roughly 80% of annual S&P 500 excess returns from 1994-2011. That pattern has fundamentally changed.
Kurov, Wolfe & Gilbert (2021) extended the sample through December 2019 and found the pre-FOMC drift essentially disappeared after 2015. The explanation: reduced uncertainty. The Fed's enhanced forward guidance has compressed average Fed Funds Rate surprises to approximately 1 basis point, leaving little risk premium to harvest.
However, the drift survives conditionally. Martello & Ribeiro (2018) demonstrate the anomaly is concentrated in high-uncertainty environments. When implied volatility exceeds its prior median, the average pre-FOMC drift is 109 basis points. When VIX is below median, it collapses to just 9.7 bps. In the bottom quintile of VIX readings, the drift turns zero or negative.
A practitioner test through December 2024 confirms this pattern: the strategy still delivers a Sharpe ratio around 0.6 when applied to leveraged ETFs during elevated volatility periods, while trading only ~5% of the time.
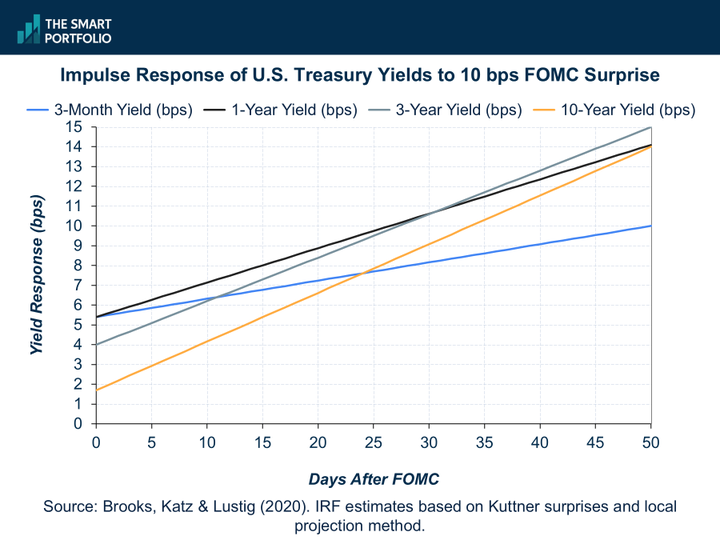
The Post-FOMC Drift in Bonds: 15-50 Days of Continuation
The more reliable pattern today is in Treasury markets. Brooks, Katz & Lustig (2018) documented substantial post-announcement drift following Fed Funds target changes. The same-day response of 10-year Treasury yields to a 10 basis point surprise in the Fed Funds Rate is only 1.7 bps, but the cumulative effect after 50 trading days reaches 14 bps. That's more than 8x the initial reaction.
For shorter horizons, Chen & Chien (2021) find the post-announcement drift in government bond futures persists for approximately 15 trading days. A strategy that goes long after expansionary surprises and short after contractionary surprises yields up to 4x the Sharpe ratio of buy-and-hold.
The mechanism: mutual fund investors respond to the salience of target rate changes by selling short and intermediate duration bond funds, gradually increasing effective supply. With inelastic short-run demand for Treasuries, this creates predictable price pressure. The authors describe it as "sticky, extrapolative expectations." Investors overestimate the persistence of Fed policy shifts.
The Post-FOMC Drift in Equities: 3 Months of Cumulative Impact
Briant (2024) quantified the equity market persistence: a 100 basis point surprise increase in the Fed Funds Rate generates a cumulative S&P 500 decline of approximately 9.8% over three months. A more realistic 25 bps surprise corresponds to a 2.45% cumulative decline over the same period.
Critically, this relationship is asymmetric. Benchimol, Saadon & Segev (2023) show that stock markets respond more aggressively to monetary policy surprises during high-uncertainty periods, with the amplifying effect stronger for expansionary shocks than contractionary ones. This aligns with the "Fed put" hypothesis: markets expect accommodation during bad times but don't expect tightening during good times.
Currency Markets: 12-24 Hour Reversal
In FX, the pattern reverses. Lee & Wang (2024) document that post-FOMC returns in currency markets are significantly negative, cancelling out approximately 65% of positive pre-announcement drifts. These reversals occur primarily 12-24 hours after the announcement, driven by uncertainty resolution and jump volatility.
Options Markets: Next-Day Drift
Zhang, Kappou & Urquhart (2025) document significant excess returns on equity options the day following scheduled FOMC meetings. The drift stems from market participants' disagreement in interpreting interest rate decisions, plus price jumps triggered by monetary surprises.
Tradeable Implementation
For the bond market drift, the entry point is clear: position after the announcement direction is known, hold for 2-3 weeks minimum. The strongest signal comes on rate-hike days, where the over-reaction is wholly concentrated.
For equities, the conditional approach dominates: only trade the pre-FOMC window when VIX is above its trailing median. Hu, Pan, Wang & Zhu (2023) provide the theoretical foundation: the premium compensates for "heightened impact uncertainty" that accumulates in the days before the announcement and resolves just prior to the release.
Disclaimer
This publication is for informational and educational purposes only. It is not investment, legal, tax, or accounting advice, and it is not an offer to buy or sell any security. Investing involves risk, including loss of principal. Past performance does not guarantee future results. Data and opinions are based on sources believed to be reliable, but accuracy and completeness are not guaranteed. You are responsible for your own investment decisions. If you need advice for your situation, consult a qualified professional.