
Sharpe Is Broken, Credit Is Predictable, and Alt Data Just Got Safer
Welcome to Academic Signal, where every week we decode finance research into plain English, share insights from providers that “sell edge” and give you access to academic braintrusts through sneak peeks into upcoming research and feedback on your research ideas.
In this week’s report:
Fixing the flaws in Sharpe and Correlation
You can capture the entire corporate credit premium in a one-week window (every month)
Innovator’s POV: Extracting alpha from faster, cleaner, and compliance-safe consumer transaction signals
1. Fixing the flaws in Sharpe and Correlation
Recurring Demand for Corporate Bonds (November 21, 2025) - Link to paper
TLDR
The Problem: Standard finance metrics (Sharpe Ratio) can't tell the difference between a smooth, steady ride and a volatile, bumpy one if the averages are the same.
The Solution: The TVS Ratio separates a stock's price into two parts: the long-term "Trend" (the signal) and the short-term "Variation" (the noise).
The Result: Portfolios built using TVS offer a smoother ride with better stability than traditional "low volatility" strategies.
The Problem: Why "Average" Can Be Misleading
Imagine two roller coasters. Coaster A goes up a steady, gentle slope. Coaster B goes up, then plummets down, then shoots up again. If they both end at the exact same height after one minute, standard finance tools often rate them as equally good.
This is the core flaw the author identifies in the Sharpe Ratio and the Correlation Coefficient.
The Shuffling Trick: If you took a stock's daily returns and shuffled them into a random order, the Sharpe ratio would remain exactly the same, even though the price chart would look completely different. The metric ignores the order of returns.
The Calendar Trap: The results change drastically depending on whether you look at daily, weekly, or monthly returns ("Return Window"). A stock might look safe on a monthly basis but terrifying on a daily basis.
The Solution: The "Dog Walker" Analogy (TVS Ratio)
To fix this, the paper introduces the Trend Variation Stability (TVS) ratio. Think of it like a person walking a dog on a leash:
The Trend (The Person): This is the smooth path the stock is generally following. The paper uses a mathematical smoothing technique (LOWESS) to draw this line.
The Variation (The Dog): This is the stock price jumping around the trend. The dog might run left or right, but it’s tethered to the person.
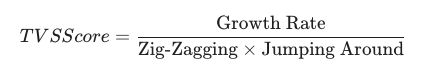
The TVS Ratio calculates a score by looking at:
Growth: How fast is the "Person" walking up the hill? (We want this high).
Variation: How wildly is the "Dog" running around? (We want this low).
Stability: Is the "Person" walking a straight line, or are they zig-zagging? (We want this steady).
The Formula Simplified:
Real-World Results: A Better "Safe" Portfolio
The authors tested this new math against the S&P 500 universe. They compared a portfolio built with TVS against a "Minimum Variance" portfolio (a standard strategy used to minimize risk).
Smoother Trends: The TVS portfolios proved to be more stable. They avoided the "zig-zagging" growth that scares investors.
Better Returns than "Safety" Strategies: While the TVS portfolio didn't beat the absolute highest-risk strategies (Tangency), it did beat the Minimum Variance portfolio in returns.
Avoiding "Crash" Stocks: Because TVS penalizes sudden variations heavily, it naturally avoids stocks prone to "black swan" events or massive volatility spikes.
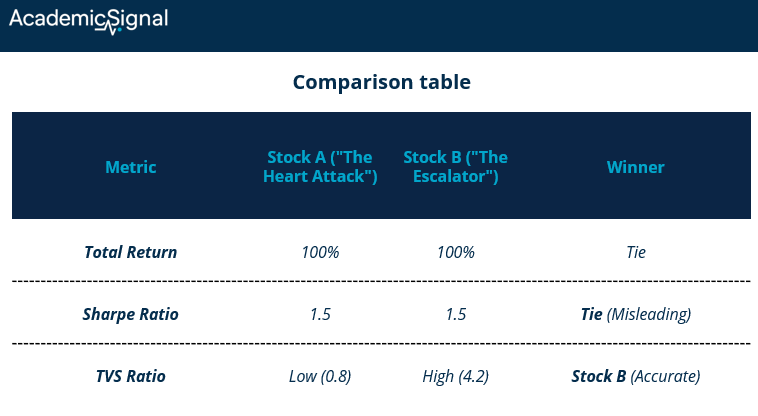
Example: The "Path Blindness" of the Sharpe Ratio
To understand why the TVS ratio matters, consider two hypothetical stocks, Stock A and Stock B. Both start at $100 and end at $200 over the same period, and importantly, they have the exact same set of daily returns, just in a different order.
Stock A ("The Heart Attack"): The price is extremely volatile. It shoots up to $180, crashes to $80, rallies to $150, and finally lands at $200.
Stock B ("The Escalator"): The price moves in a near-perfect diagonal line, compounding steadily from $100 to $200 with minimal deviation from its trend.
The "Sharpe Trap"
Because the Sharpe Ratio calculates volatility based on the distribution of returns – not their order – it rates both stocks exactly the same. To the Sharpe Ratio, a 10% drop is a 10% drop, whether it breaks a multi-year trend or is just noise.
The TVS Reality
The TVS ratio recognizes that Stock B is superior for a growth strategy. By measuring the distance between the price and the trend (rather than the mean return), it heavily penalizes Stock A for its erratic path.
The Takeaway:
If you optimize for Sharpe, you might unknowingly load your portfolio with "Stock A" profiles – assets that achieve returns through stress-inducing volatility. If you optimize for TVS, you mathematically filter for "Stock B" profiles – assets that provide a smooth, compounded ride.
How Investors Can Use This
The paper suggests two main uses for professional investors:
The Screener: You can rank every stock in the S&P 500 by its TVS score. High-scoring stocks are "smooth growers" – companies that trend up consistently without making investors seasick.
Portfolio Construction: Instead of just picking stocks that don't move together (correlation), you pick stocks that smooth out each other's "dog running" noise while keeping the "person walking" trend moving upward.
The Bottom Line
The TVS ratio is a tool for the Growth Investor who hates surprises. It acknowledges that earning 10% smoothly is better than earning 10% with heart-stopping volatility. By mathematically separating the "Trend" from the "Noise," it helps build portfolios that are easier to hold onto for the long term.
2. You can capture the entire corporate credit premium in a one-week window (every month)
Recurring Demand for Corporate Bonds (November 18, 2025) - Link to paper
TLDR
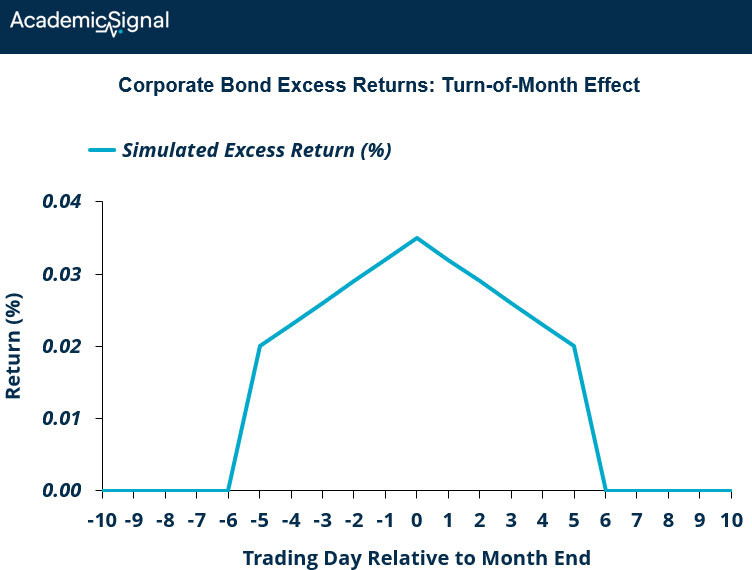
Nearly the entire credit premium on investment-grade corporate bonds accrues during a narrow 8-day window around the turn of the month. The rest of the month generates zero excess returns over Treasuries.
This pattern is driven by passive bond funds mechanically reinvesting distributions at month-end to minimize tracking error against Bloomberg indices.
Corporate issuers exploit this predictable demand by timing bond offerings to the first week of the month, securing lower yields.
What the authors discovered
Using 12 years of TRACE transaction data covering $11 trillion in U.S. corporate bonds, the authors document a stunning anomaly: yield spreads compress by approximately 4 basis points during the last trading day of each month through the first week of the next month. This translates to roughly 30 basis points in price appreciation over just eight trading days.
The pattern is remarkably consistent. A simple strategy of buying corporate bonds five days before month-end and selling five days into the new month captured essentially all of the corporate bond premium from 2011-2022, generating a Sharpe ratio of 0.94. During the remaining 12-15 trading days each month, corporate bonds earned near-zero excess returns over Treasuries.
The mechanism: index methodology meets fund flows
The culprit is the Bloomberg Aggregate Bond Index – the benchmark for over 90% of passive bond fund assets. Bloomberg's methodology assumes that all cash proceeds (coupons, called bonds, maturing securities) earn zero return during the month and are only reinvested pro rata across the index at month-end.
This creates a powerful incentive: any passive fund that reinvests before month-end generates tracking error. So fund managers accumulate cash throughout the month from coupon payments (which must be distributed to investors for tax purposes but are largely auto-reinvested), bond calls, and securities dropping below the index's 1-year maturity threshold. Then they deploy it all at once around the turn of the month.
The authors prove this mechanism by constructing a bond-level "reinvestment pressure" metric that predicts which bonds experience the most severe yield compression. Bonds with high expected reinvestment demand see 5 basis point spread compression at month-end, while low-pressure bonds show minimal effect.
The passive fund fingerprint
The effect is overwhelmingly driven by passive funds. When the authors decompose reinvestment pressure by fund type, they find that passive fund reinvestment strongly predicts turn-of-the-month yield changes, while active fund reinvestment shows no relationship. This makes sense: active managers have flexibility in both timing and security selection, while index trackers are locked into month-end rebalancing.
The pattern emerged post-2008 as passive bond funds grew from 7% to over 20% of the corporate bond market. Pre-crisis data from 2002-2010 shows no turn-of-the-month effect, providing a natural experiment that reinforces the fund flow explanation.
The bottom line for investors
Simply overweight corporate bonds during the turn-of-the-month window and reduce exposure mid-month. The effect persists even excluding FOMC dates and macro announcements, so it's not information-driven.
3. Innovator’s POV: Extracting alpha from faster, cleaner, and compliance-safe consumer transaction signals
In a market drowning in data and compliance anxiety, our audience of 20,000+ professional investors is constantly hunting for a differentiated signal. We sat down with Chad Whitney, Facteus' CRO/Head of Revenue, to discuss how they’re solving the core challenges of consumer data speed, quality, and risk.
KP: Many alt data providers offer raw data - what’s unique about your data?
CW: The key to our differentiation is the source. We sign exclusive data agreements directly with Financial Institutions, putting us right at the point of "card swipe."
Most other data sets are an exhaust from a loyalty or rewards program. Those panels can be very useful in certain situations but are inherently more biased; their users fit specific demographics that can skew the signal and force your quant team to spend months de-biasing.
Our direct access means we see every single transaction for 180 million consumers daily AND that we can deliver data with a crucial one-day lag for maximum speed to alpha.
KP: And how do you handle PII risk without compromising data quality?
CW: Compliance and PII (Personally Identifiable Information) risk are the number one roadblocks for sensitive data adoption. That’s why we only use synthetic data.
We synthesize the data behind the financial institution’s firewall so everything is hashed and obfuscated.
Let’s say you bought a burger at Shake Shack for $9.50… your personal information would be removed and then we’d also change your data so it’s impossible to reverse-engineer it back to you, even if they knew that you went there and how much you spent.
Via our proprietary models, we inject noise into the data in such a way that the statistical relevancy of the data isn’t compromised.
KP: How can funds with limited data science teams leverage your data?
CW: For the most sophisticated systematic funds, we offer Ultra, the "fire hose" high-speed data feed. But we recognize not every fund has a dedicated army of data scientists.
For smaller funds or family offices, we focus on usability and cost efficiency. We have summarized feeds, and most importantly, a dashboard where fundamental teams can track historical trends and KPIs without complex ingestion. This allows them to buy data per their needs - the full panel or by the ticker without having to worry about data ingestion or data science..
KP: What’s the next “alt data” frontier? Where is Facteus looking to uncover new signals?
CW: We want to wrap other data sets around the core spend data. Specifically, we're focused on uncovering signals from B2B spend, cross-border payments, and more granular POS (Point-of-Sale) related data… complementary data assets that tell a broader, more predictive story.
This combined view allows clients to understand consumer behavior shifts in far greater depth. For example, seeing why a consumer might be trading down from one apparel brand to a lower-cost alternative.
Our aim is always to provide actionable, fact-rooted insights that drive your investment strategies. We view this as a long-term partnership; if we can't deliver clear, long-term value, we will actively suggest a better fit, because mutual success is our top priority.
Disclaimer
This publication is for informational and educational purposes only. It is not investment, legal, tax, or accounting advice, and it is not an offer to buy or sell any security. Investing involves risk, including loss of principal. Past performance does not guarantee future results. Data and opinions are based on sources believed to be reliable, but accuracy and completeness are not guaranteed. You are responsible for your own investment decisions. If you need advice for your situation, consult a qualified professional.