
How Sports Stocks Double Your Sharpe Ratio
Launching Research-grounded Investor Q&A. Have an interesting idea and would like a thesis check grounded on academic research? Email your query to kp@academicsignal.com and our Research Fellows will tackle the most interesting questions.
In this week’s report:
Adding Sports stocks to your portfolio can significantly improve your Sharpe ratio
A “factor momentum” REIT investing strategy that generates 6% alpha
Research-grounded Investor Q&A: “Do insider purchases predict stock returns, and which types of insider trades are most informative?” [Premium Content]
1. Adding Sports stocks to your portfolio can significantly improve your Sharpe ratio
Sport as an Alternative Asset Class: Foundations and Conceptual Framework (December 2, 2025) - Link to paper
TLDR
A new Sports Companies Index (SCI) of 21 publicly traded sports organizations shows near-zero correlation with equities (0.016), bonds (0.013), REITs (0.006), and listed private equity (0.024)
Standard factor models explain virtually nothing: CAPM R² is 0.0002, and the five-factor model captures just 0.2% of return variation
Adding SCI to a diversified portfolio more than doubles the tangency portfolio Sharpe ratio (from 0.025 to 0.063).
What the author built
This paper introduces the Sports Companies Index: the first transparent, replicable benchmark for publicly listed sports organizations. The SCI includes 21 firms whose primary business is owning and operating professional sports teams: Manchester United, Juventus, Borussia Dortmund, Liberty Media's Formula One and Braves holdings, Madison Square Garden Sports, and TKO Group (WWE/UFC), among others. The index is equally weighted with daily frequency, covering January 2021 to November 2025.
The striking statistical properties
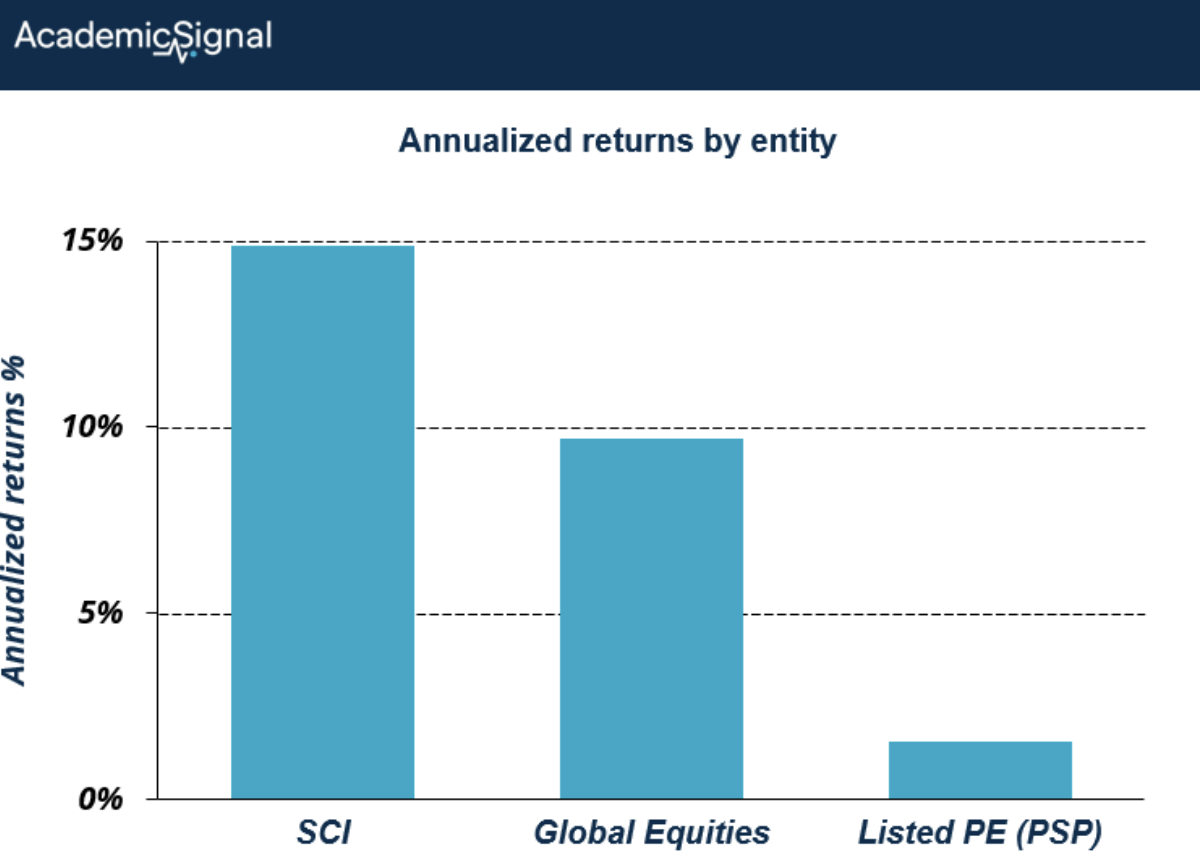
The SCI delivered 14.86% annualized returns with 12.64% volatility – better risk-adjusted performance than global equities (9.69% return, 16.09% vol) and dramatically better than listed private equity (1.55% return, 23.70% vol).
The study benchmarks against listed private equity using PSP (Invesco Global Listed Private Equity ETF), which holds publicly traded firms whose core business is private equity investing—names like KKR, Blackstone, Apollo, Carlyle, and Partners Group. This gives liquid, daily-priced exposure to the PE asset class without the J-curve and lock-up constraints of direct fund commitments.
More importantly, correlations are essentially zero. The SCI shows 0.016 correlation with MSCI ACWI, 0.024 with listed private equity, and 0.006 with REITs. These aren't just "low"; they're statistically indistinguishable from zero.
Why factor models fail completely
The CAPM regression produces an R² of 0.0002, meaning that market risk explains just 0.02% of SCI return variation.
To put that in perspective: if you tried to predict tomorrow's SCI return using today's market return, you'd capture essentially nothing. The remaining 99.98% of variance comes from factors outside the model. Market beta is 0.012 (essentially flat to global equities).
CAPM regression is the simplest test of whether an asset moves with the market.
The model:
Asset Return = α + β × Market Return + error
What it measures:
Beta (β): How much the asset moves when the market moves. A beta of 1.0 means it moves 1:1 with the market. A beta of 0.5 means it moves half as much.
Alpha (α): The return left over after accounting for market exposure, often interpreted as "excess return" or manager skill.
R²: The percentage of the asset's return variation explained by market movements.
Why it matters here:
For a typical stock, the CAPM R² might be 0.30 to 0.50, meaning that 30-50% of its daily ups and downs are explained by broad market movements. For a sector ETF or index fund, R² could be 0.80 or higher.
The Sports Companies Index shows an R² of 0.0002 (0.02%). That's essentially zero. It means knowing what the market did today tells you almost nothing about what sports stocks did.
That's the core finding: sports equities behave like their own isolated asset class, not like a quirky corner of the equity market.
Against the Fama-French five-factor model
Adding size, value, profitability, and investment factors in the Fama-French five-factor model improves R² to just 0.2%. Still virtually zero explanatory power.
This isn't noise, it's signal. Sports equity returns are driven by mechanisms entirely outside conventional risk premia: competitive outcomes, league structures, broadcast rights cycles, fan engagement, and institutional rules around revenue sharing and financial fair play.
At the individual club level, only Manchester United shows meaningful market sensitivity (beta = 0.69). Every other club displays statistically insignificant exposure to global equities.
The portfolio construction case
The paper tests whether adding SCI improves a diversified portfolio using mean-variance optimization. The tangency portfolio is the portfolio on the efficient frontier with the highest Sharpe ratio – the point where a line from the risk-free rate touches the frontier. It represents the optimal mix of risky assets for any investor who can borrow or lend at the risk-free rate.
Including SCI in a four-asset portfolio (equities, bonds, REITs, private equity) increases the tangency portfolio Sharpe ratio from 0.025 to 0.063, a 150% improvement. This is an unusually large diversification benefit, driven by the combination of moderate returns, reasonable volatility, and near-zero correlation with everything else in the portfolio.
The bottom line
Sports organizations represent genuine diversification, not just low correlation that disappears in crises, but structural independence from traditional risk factors. The value drivers (competitive uncertainty, cultural scarcity, institutional interdependence) have no analogue in conventional asset classes.
For allocators, the SCI offers a replicable way to access this exposure through public markets. The limited number of constituents (21) means liquidity constraints exist, but the conceptual case for sports as a distinct alternative is now empirically grounded.
2. A “factor momentum” REIT investing strategy that generates 6% alpha
Momentum Factor or Factor Momentum in REIT Market? (October 29, 2025) - Link to paper
TLDR
Traditional factor strategies (momentum, value, size, profitability) generate zero alpha in REITs after controlling for market risk (in contrast with equities)
A dynamic “factor momentum” strategy that rotates into recent winner factors and shorts losers delivers 6% annual alpha with a 1.35 Sharpe ratio
The strategy earns 39% annualized returns in the worst 10% of market months, exhibiting strong "safe haven" characteristics
What the authors did
Tomtosov, Rechmedina, and Dobrynskaya studied whether classic factor strategies work in U.S. REITs from 1998-2021. They built five long-short factor portfolios – momentum, value (P/E), size, profitability (operating margin), and adjusted funds from operations (AFFO) – by sorting all REITs by each characteristic, going long the top 50% and short the bottom 50%, with equal weighting within each leg. Then they tested a dynamic strategy that rotates across these factors based on trailing performance.
How they built the factor momentum strategy
"Factor momentum" applies the momentum principle to factors themselves rather than individual securities. Ehsani and Linnainmaa (Factor Momentum and the Momentum Factor, December 2020) first documented this in equities: just as stocks with strong recent returns tend to continue outperforming, factors with strong recent alphas tend to persist. The strategy exploits this by overweighting recent winner factors and underweighting losers.
Each month, the authors ranked all five REIT factors by their trailing 12-month CAPM alpha. The strategy goes long the top two factor portfolios and shorts the bottom two, rebalancing monthly.
The underlying dynamic: factor returns in REITs show short-to-medium term persistence (a winning factor tends to keep winning for several months), but experience longer-term regime changes where different factors take the lead.
The 12-month lookback captures the persistence, while monthly rebalancing adapts when regimes shift. The authors don't explicitly identify rotation drivers, but in equity markets it's typically attributed to changing economic conditions, sentiment cycles, and mean reversion after factor crowding.
What they found
Individual factors delivered disappointing results. The momentum factor actually showed reversal with a -3.81% average return. Value, size, profitability, and AFFO all had returns statistically indistinguishable from zero. A naive multifactor portfolio – 20% allocated to each of the five factors, rebalanced to equal weights – generated negative returns.
Factor momentum told a different story:
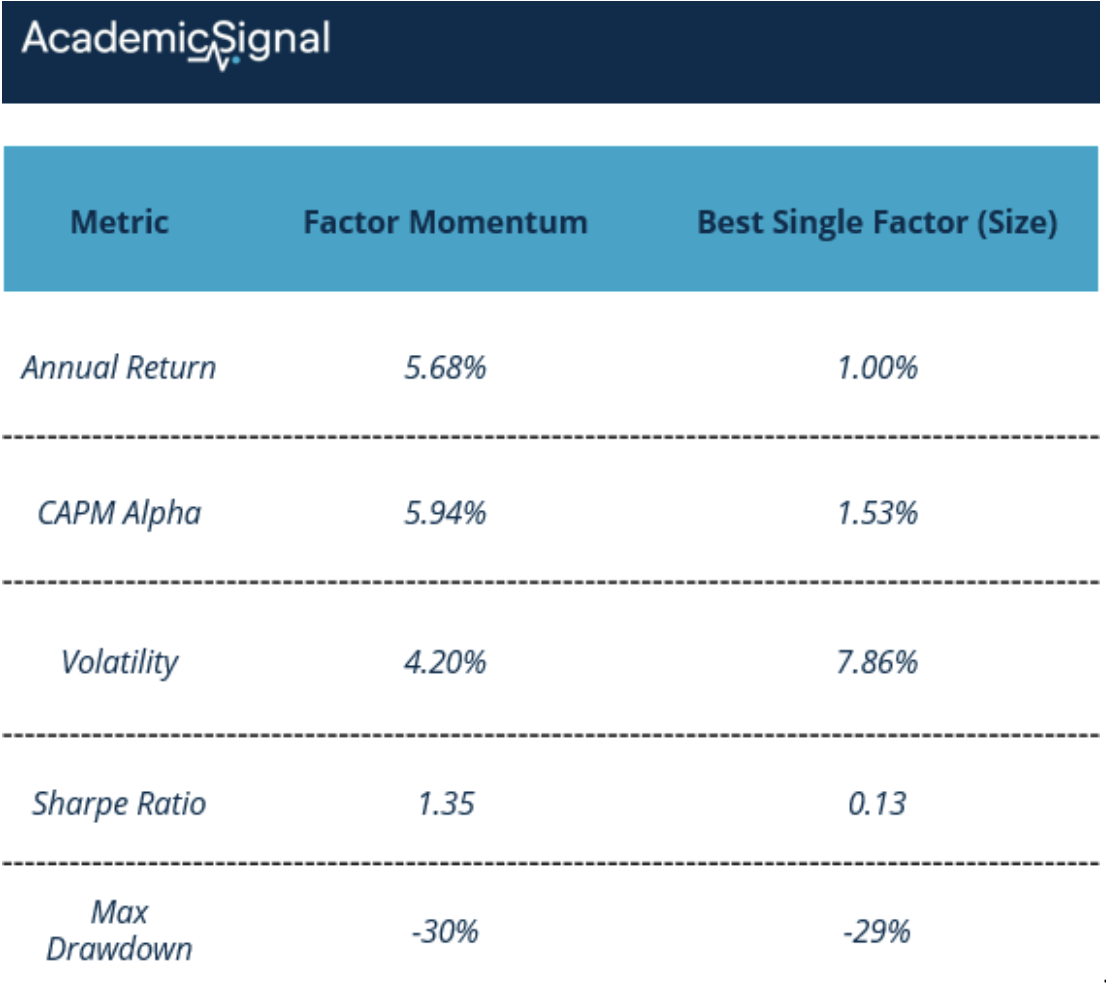
The alpha held up across six different factor models including Fama-French five-factor, momentum, and liquidity – ranging from 5.83% to 9.11% annually, all statistically significant.
Why the downside performance matters
During the bottom 10% of REIT market months, factor momentum earned 38.89% annualized returns. During the top 10%, 34.92%. The strategy has negative exposure to both equity market risk and VIX, making it a natural hedge for equity-heavy portfolios.
Sub-period analysis shows consistency. From 2018-2021 – including the COVID crash – the strategy returned 15.08% annually while momentum cratered at -8.31%.
The bottom line
Static factor investing works in equities. Fama and French (1993) documented persistent value and size premiums averaging 3-5% annually. Carhart (1997) showed momentum earns ~8% annually. Arnott et al. (2019) confirmed that equally-weighted multifactor equity portfolios generate sustainable long-term excess returns.
REITs behave differently. The authors show REIT factors spend 70% of their time in "bear" and "rebound" phases versus 70% in "bull" and "correction" phases for equity factors. Static exposure doesn't work here – but factor momentum exploits exactly this instability.
For REIT allocators: track trailing 12-month alphas across standard factors, overweight recent winners, underweight losers, rebalance monthly. The negative market beta and volatility exposure offer diversification benefits for equity portfolios: crisis alpha in a yield-oriented asset class.
3. Research-grounded Investor Q&A: “Do insider purchases predict stock returns, and which types of insider trades are most informative?”
Yes, but the signal quality varies by trade type. The foundational finding comes from Lakonishok & Lee (1998 and 2001), who documented that insider purchases predict positive abnormal returns – particularly in smaller firms – while insider sales carry minimal predictive power due to diverse selling motivations (liquidity, diversification, taxes).
The critical breakthrough came from Cohen, Malloy & Pomorski (2010), who distinguished "opportunistic" trades from "routine" ones (predictable, calendar-based patterns). Opportunistic purchases generate value-weighted abnormal returns of 82 bps monthly (≈10% annualized), while routine trades produce essentially zero alpha. Opportunistic trades also predict future firm-specific news and earnings surprises.
Informativeness also varies by insider role. Knewtson & Nofsinger (2013) found that CFO purchases outperform CEO purchases, attributable to CFOs' deeper visibility into financial fundamentals. Cluster buying – multiple insiders purchasing within a short window – amplifies signal strength.
It’s interesting to note that even 10b5-1 "preplanned" sales aren't noise-free; Jagolinzer (2009) documented that these trades still systematically precede negative performance, suggesting strategic timing persists despite regulatory intent.
The Cohen, Malloy & Pomorski (2010) paper merits digging a bit further to understand how it works and what it means…
The Classification Step (Once Per Year)
At the beginning of each calendar year, for every insider in the database, they examine that person's prior 3 years of trading history:
Routine Insider: Traded in the same calendar month for at least 3 consecutive years (e.g., sold every December for 3 straight years, likely tax-loss harvesting or bonus-related)
Opportunistic Insider: Everyone else, traded in the prior 3 years, but without predictable monthly patterns
This classification divides the insider universe roughly 55/45 (routine/opportunistic).
The Actual Portfolio Construction
At the end of each month t:
Identify all stocks where an opportunistic insider made a purchase during month t → These go into the Long portfolio
Identify all stocks where an opportunistic insider made a sale during month t → These go into the Short portfolio
Hold both portfolios for the entirety of month t+1
At the end of month t+1, rebalance completely based on new opportunistic trades
Practical Timing Considerations
The authors verified that nearly all trades were reported to the SEC within a few days (median: 3 days), so the information was available to outside investors by month-end. They also re-ran the analysis using an even more conservative approach – waiting until the 11th of the following month (the official SEC deadline at the time) – and the results were "virtually identical."
The Returns Breakdown
The equal-weight strategy generates 21.6% annualized, but that's concentrated in smaller, less liquid names. The value-weight strategy's 9.8% annualized is more realistic for institutional capital.
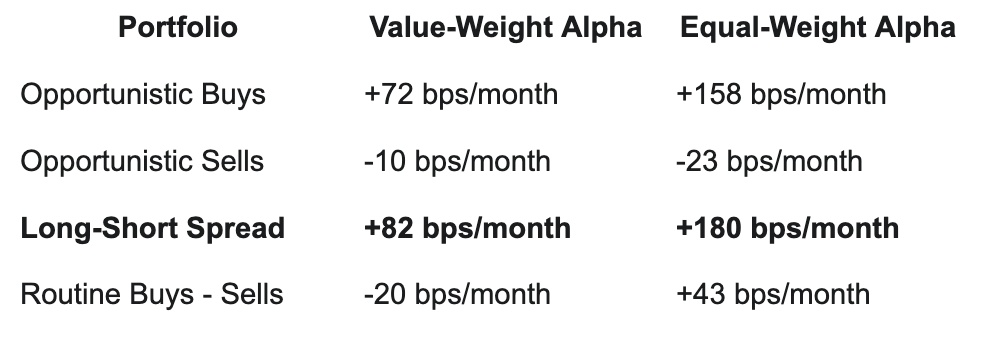
Key Finding: Sells Matter
A surprising result: over half the alpha comes from the short side. Opportunistic sells dramatically underperform routine sells. This contradicts the common belief that insider sales are uninformative. The routine/opportunistic distinction unlocks the signal in sales data.
Disclaimer
This publication is for informational and educational purposes only. It is not investment, legal, tax, or accounting advice, and it is not an offer to buy or sell any security. Investing involves risk, including loss of principal. Past performance does not guarantee future results. Data and opinions are based on sources believed to be reliable, but accuracy and completeness are not guaranteed. You are responsible for your own investment decisions. If you need advice for your situation, consult a qualified professional.